The Accumulation / Distribution (A/D) indicator is an effective volume indicator developed based on the accumulation-distribution index and Volume values. The author of the tool is a famous trader named Marc Chaikin.
Unlike Bill Williams' similar Acceleration/Deceleration indicator, which compares opening and closing prices, it compares the closing price with the middle of the trading range.
Calculation of indicator values
A / D calculation starts with calculating the difference between the closing price and the daily minimum, from which the difference between the maximum and closing price is subtracted. The resulting indicator is divided by the difference between the maximum and minimum, after which it is multiplied by the trading volume. At the final stage, the result is added to the Accumulation / Distribution value recorded on the last candle. That, in turn, is the sum of the indices for all previous periods. The larger the volume, the stronger the indicator responds to price movements.
Accumulation = ((Close - Low) - (High - Close)/(High - Low) x Volume) + A / D-1.
When an asset closes at the maximum of the trading period, the Accumulation / Distribution value is equal to the volume. When the closure occurs in relative proximity to the upper extremum, we get a certain percentage of the volume indicator (above zero). When placed next to the minimum, the volume is multiplied by a minus number from zero to one. If the price closed exactly in the middle, the A/D value is zero.
Recall that accumulation means the purchase of assets by large players before the onset of a powerful uptrend. Distribution is the process of closing positions at the peak of the bull market. The rise of the line means that during this period, there is a process of accumulation. A decrease in the A / D curve indicates a downward trend and distribution. Thus, looking at the chart, in a few seconds, you can evaluate the balance of power of buyers and sellers in the current market.
Accumulation / Distribution Indicator Signals
The Accumulation / Distribution indicator can distinguish three types of signals:
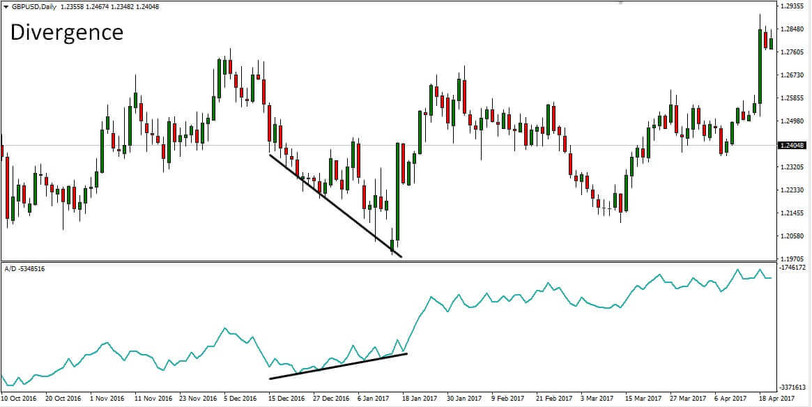
1. The divergence between price and indicator values.
If with an uptrend, the next update of the maximum is not confirmed by a similar movement of the Accumulation / Distribution curve, then it is likely that the trend begins to lose strength. In the near future, a reversal or correction is possible. If the divergence is confirmed at the next high, you should seriously consider opening a sell position. This is exactly the case in the case of divergence with a steady downward movement. Lack of confirmation of a new price low is a sign of the end of the trend, and you can look for a moment to enter the purchase.
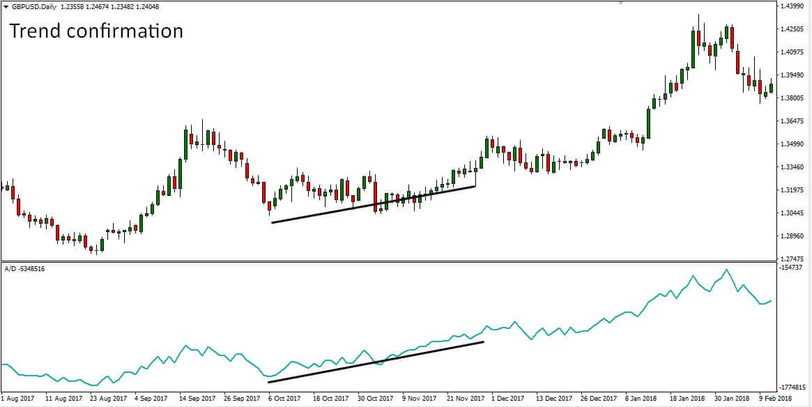
2. Confirmation of the trend. If the peaks are updated synchronously with a growing trend, then the movement is stable. With a falling market, the situation is similar; only we are talking about chart lows.

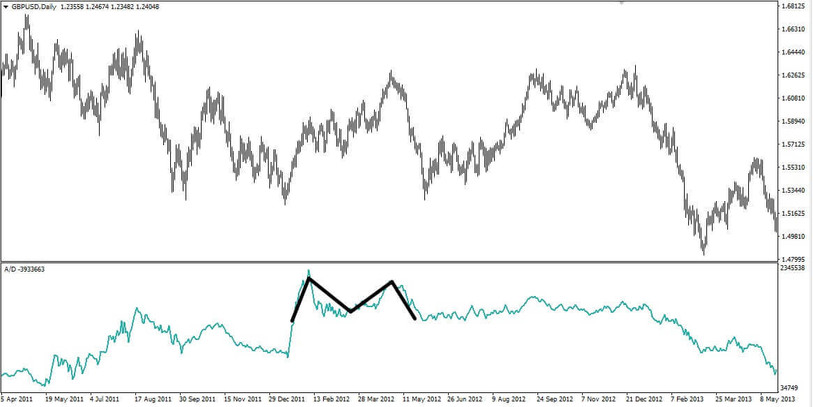
3. Formation of technical analysis figures in the indicator window. Patterns of technical analysis formed in the A / D indicator window usually appear there earlier than on the price chart.

Conclusion
The Accumulation / Distribution indicator was originally created for the stock market, where real volumes are present. When using this indicator on Forex, it should be remembered that volumes on the Forex market are tick volumes, which may differ from real trading volumes, especially on small timeframes. Therefore, we believe that this tool will be most effective on higher timeframes, where the difference between a tick and real volumes is insignificant and can be ignored. You can find some strategies using the Accumulation / Distribution indicator on our website in the Strategies section.
Download the Accumulation Distribution (A/D) Chaikin indicator for MT4 from the button below
Tip: Can’t open the downloaded archive file (ZIP or RAR)?
Try WinRAR for Windows or The Unarchiver for Mac .
Do you need help with installing this indicator into MT4 for Windows or Mac OS? Our guide HERE will help you.


