ADX Trading Indicator is a popular indicator that determines the strength and prospects of the current market trend. This analysis tool was developed by the famous trader Welles Wilder on the basis of two of his other programs - Positive Directional and Negative Directional indicator.
This indicator is usually present in the standard MetaTrader terminal library. You can also download it on our website from the link below at the end of this article.
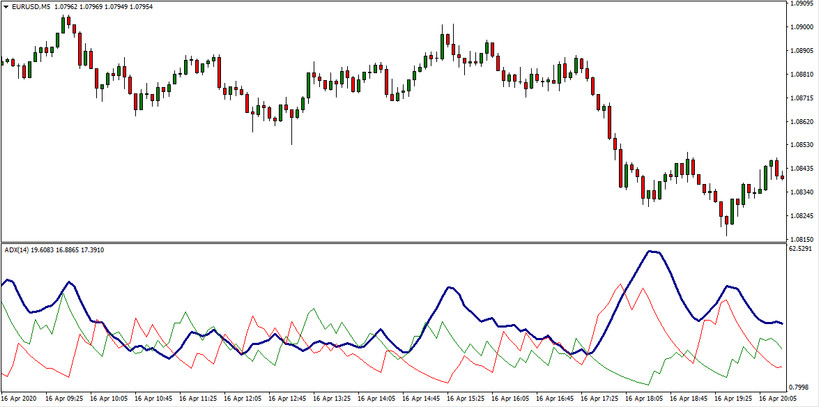
The ADX indicator is a graph in a separate window on which three curves are placed: +DI, -DI and ADX. They range from zero to one hundred. The movements of these lines give certain trading signals.
The ADX curve is the exponential average of –DI and +DI. It reports on market sentiment - whether there is a trend at the moment (the strength of this trend) or whether the price will be in a sideways movement. The presence of a stable trend is evidenced by an increase in ADX, accompanied by a divergence of DI and –DI in different directions. The convergence of these lines signals a gradual attenuation of the movement. The intersection of the lines DI and -DI also indicates the possible emergence of a trend.
ADX settings
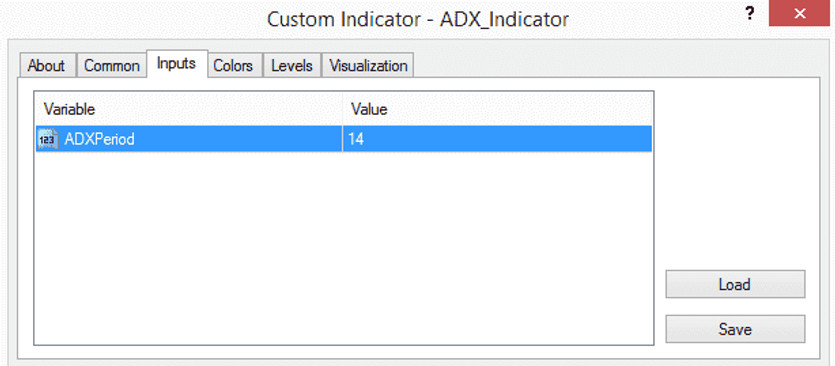
The indicator settings have only one parameter - ADX_Period, whose default value is 14. Decreasing the ADX period will generate more frequent signals. It is recommended to reduce this period only in strategies with short-term trading. An increase in period, on the contrary, will give rarer signals.

If ADX falls into the area between 20 and 40, it indicates a weak trend. If the line breaks through 40 and continues to move up, a strong trend can be observed. The growth of this curve means an increase in the trend, but in itself, it does not report anything about its direction. When the ADX line falls below 20, we can expect a flat for a certain time and apply a flat trading strategy along with this indicator.
ADX Signals
The ADX indicator generates the following signals that are worth paying attention to:
- A rise in the ADX line above 40 indicates a possible continuation of the trend;
- A drop in the ADX line below 20 indicates a possible flat;
- The intersection of the –DI and DI lines indicates a possible emergence of a trend;
- The divergence of the lines -DI and DI indicates the continuation of the trend.
Conclusion
ADX is a fairly well-known indicator that is widely used in building various trading strategies. In the Strategies section of our website, you can find strategies which use the ADX indicator, in our opinion, many deserve attention.
Download the ADX indicator for free from the button below
Tip: Can’t open the downloaded archive file (ZIP or RAR)?
Try WinRAR for Windows or The Unarchiver for Mac .
Do you need help with installing this indicator into MT4 for Windows or Mac OS? Our guide HERE will help you.


