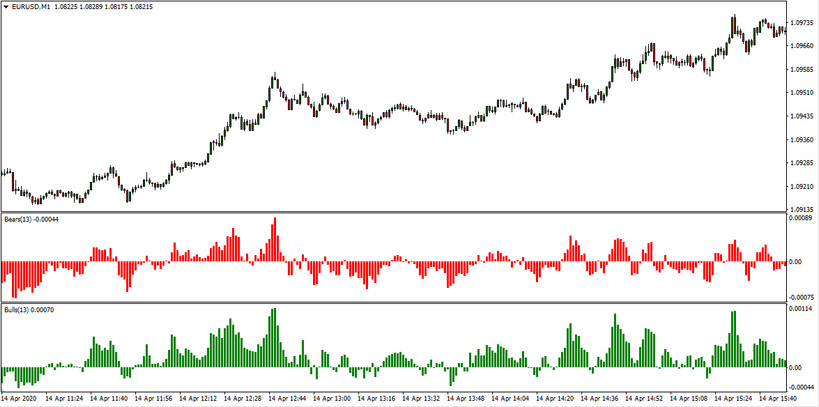
As know, at any given time in the market, there are always two forces: buyers and sellers, or in the trader's jargon - bulls and bears. Bulls and Bears indicators are designed to facilitate the trader's understanding and search for the dominant power in the market at a certain point in time. Both tools are visualized in separate windows in the form of columns of histograms.
These indicators are included in the standard Metatrader4 terminal code package, and you can also download these indicators on our website from the link below.
In any trading strategy, it is recommended to use both of these indicators together, as the Bulls indicator reflects the mood of buyers, and the Bears indicator displays the strength and mood of sellers. A clearer picture of the market can be compiled from the readings of both indicators.
Calculation formula
The calculation of both indicators uses a moving average. The calculation of the indicator columns is carried out according to the following formula: BULLS = HIGH - EMA for the Bulls indicator and BEARS = LOW - EMA for the Bears indicator. As you can see from the formula, the difference between the two indicators is only that for the first the value of the moving average is subtracted from the high value of the candle, and for the second the value of the moving average is subtracted from the candle's low of the corresponding period.
Indicator settings
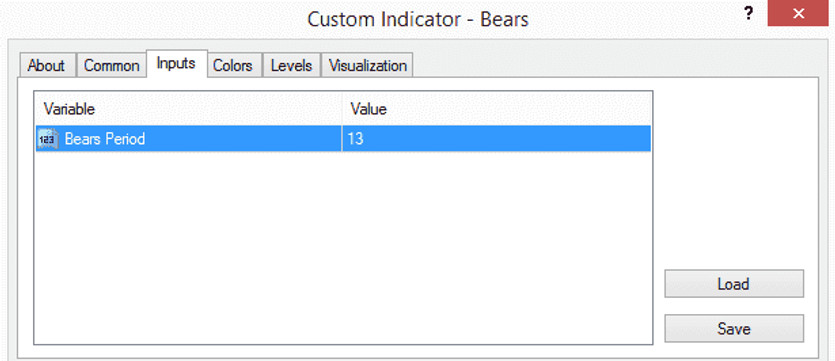
The settings of both indicators have only one parameter - the moving average period, which by default is 13. Depending on the use of the trading strategy, this parameter can be changed in accordance with the requirements of the system.

Signals of the indicator
The upward growth of the bars of the Bulls indicator histogram above the zero marks indicates an upward price movement. In this case, investors may consider opening orders to buy an asset.
The downward growth of the bars of the Bears indicator histogram below the zero marks indicates a downward price movement. This is an opportunity to open orders to sell an asset.
When searching for signals, one should pay attention to the discrepancy in the values of these indicators, as well as the indications of the maximum and minimum values of each of them.
Conclusion
Bulls and Bears tools are recommended to be used in conjunction with trend oscillators or indicators in building trading strategies. This is necessary, as trend indicators accurately indicate the direction of a developing trend.
Some of these strategies using these indicators can be found on our website in the Strategies section.
Download the Bulls Power And Bears Power Indicators From The Button Below
Tip: Can’t open the downloaded archive file (ZIP or RAR)?
Try WinRAR for Windows or The Unarchiver for Mac .
Do you need help with installing this indicator into MT4 for Windows or Mac OS? Our guide HERE will help you.


