Support and resistance levels are an excellent tool for technical analysis. However, sometimes it can be difficult to determine whether a breakout has actually occurred, or whether the price is just testing the level. The Mean Reversion indicator helps in identifying false breakouts, increasing the quality of the analysis.
As you know, the price has the ability to always return to the average. The indicator exploits this feature using a not quite standard mathematical approach. It is based on regression analysis, specifically - polynomial regression, on the basis of which the so-called "center of gravity" of the price is formed. The indicator allows you to determine with a sufficient degree of probability whether the price will break through the support/resistance level, continuing to move in the intended direction, or bounce off it.
Indicator settings
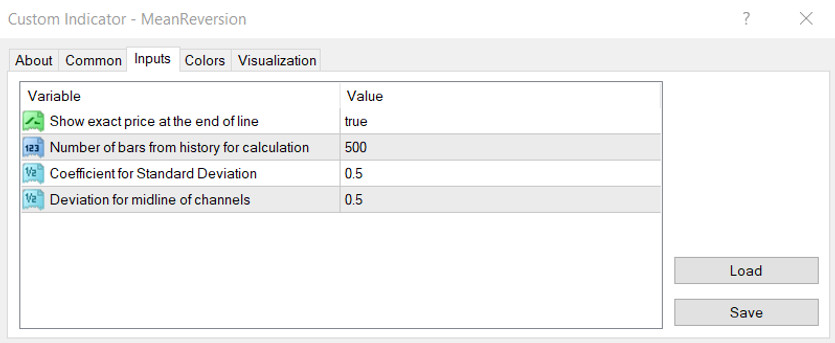
The following settings can be set in the indicator parameters:
1. Enables or disables price labels on the right side of the chart;
2. The number of bars for calculation;
3. The coefficient of the standard deviation - affects the spreading of all lines;
4. The relative position of the middle lines (gray) - takes values from 0 to 1.

Indicator signals
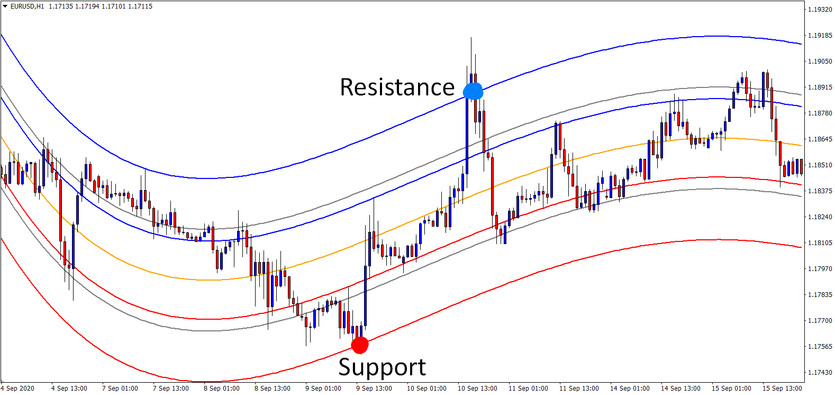
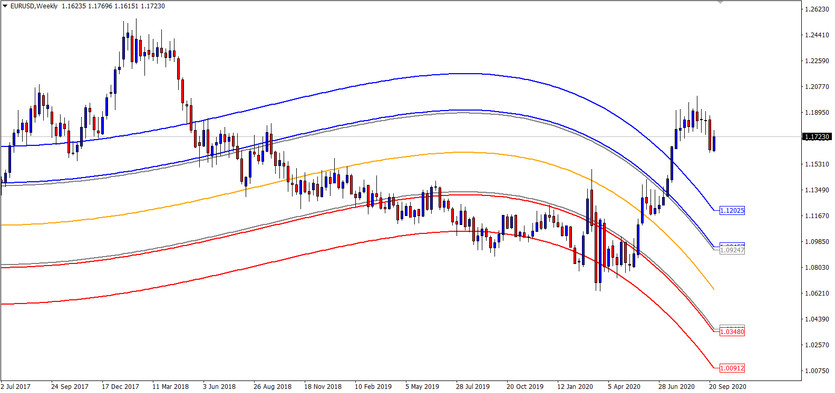
The algorithm's main task is to determine if the market is in the overbought or oversold zone. The Mean Reversion indicator draws a channel that defines the extreme zones for the price. The extreme channel lines define the overbought and oversold areas. If the price touches the upper line, it is a strong sign of buyers' exhaustion - the market simply cannot handle the pressure. Conversely, when the price is at the lower boundary of the channel, it is a good sign that sellers are weakening.

The indicator can also be used to determine the points of exit from a position. Let's say a sell order has been opened following a downtrend. The task is to determine when the trend will end, and the price will reverse in the opposite direction. A sufficiently reliable signal is the price entering the oversold zone, touching the channel's lower border. This means that the market has weakened, most likely a rebound will occur, which is the time to take profits.
Following the same principle, you can enter at a profitable price on trend pullbacks. For example, in the case of an uptrend, enter or add a position when touching the lower border of the trend channel.
Conclusion
One of the main advantages of the indicator is independence from a specific trading pair and timeframe. The indicator shows itself equally well both on crosses and on majors. All that needs to be done is to adjust the parameters to the instrument's volatility so that the price stays within the channel most of the time.
Mean reversion is a multipurpose tool that can be used to confirm entry into a position and find the best exit point from it. Much better results can be achieved by selecting the indicator parameters for the level of volatility of the trading pair so that the price is within the channel boundaries most of the time. In this case, the definition of overbought and oversold zones will be the most accurate.


