The Money Flow Index (MFI) shows the intensity with which funds are invested in and out of an asset. This is a rather useful tool for assessing the development prospects of a trend. It is very easy to use and not cluttered with unnecessary information.
You can download it from the link below.
MFI indicator formulas
The calculations of this indicator are approximately similar to the calculations of the well-known RSI indicator. The difference is that in MFI, in addition to the standard calculations of this indicator, the volume is also taken into account.
Building MFI values involves several steps:
- First, the typical price of the specified period is determined. A typical price is calculated as the sum of the high, low, and close candles divided by 3. TP = (HIGH + LOW + CLOSE) / 3.
- Then the money flow value is calculated by multiplying the obtained value of the typical price by the volume of the bar. MF = TP * Volume.
- If today's typical price is higher than yesterday, then money flow is considered positive. If today's typical price is less than yesterday, money flow is considered negative.
Positive money flow (POSITIVE MONEY FLOW) is the sum of the positive money flow values for the selected period. Negative flow (NEGATIVE MONEY FLOW) is the sum of the negative money flow values for the selected period.
Then the money ratio (MR) is determined by dividing the positive flow by negative:
- MR = POSITIVE MONEY FLOW / NEGATIVE MONEY FLOW
- And finally, using the money ratio, the flow index is calculated:
- MFI = 100 - (100 / (1 + MR))
MFI indicator settings
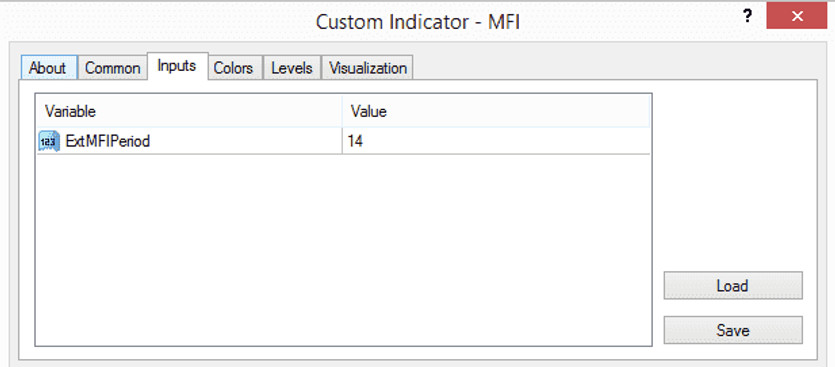
This tool has only one parameter in its settings: ExtMFIPeriod. These are the values of the period for which the MFI calculates the values; the default is 14. By increasing or decreasing this value, you can achieve flexibility in using it on different timeframes.

Indicator signals
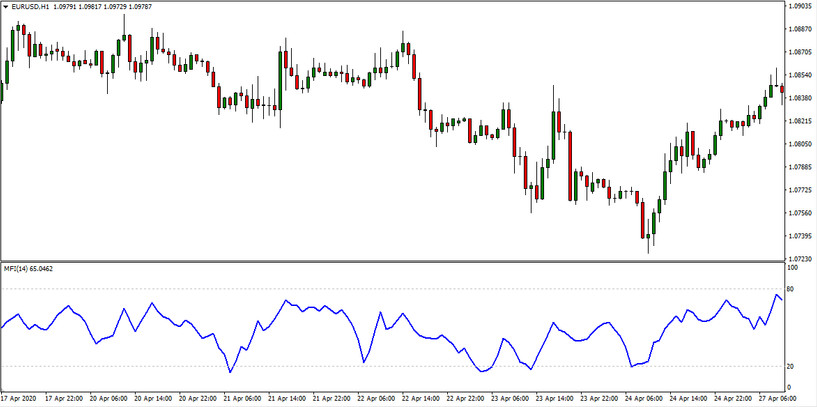
MFI shows two types of signals: potential extremes, after which a trend reversal and divergence between the indicator and price are possible.
If the indicator line crosses level 20 - this indicates an oversold asset and the potential opportunity to buy profitably. The intersection of the level 80 indicator line, on the contrary, signals a possible profitable sell of the active.
The second thing you should pay attention to is the divergence between the values of the indicator and the price. If the indicator line rises, but the price falls, this is a buy signal. In the opposite situation, when the indicator value falls and the price rises, the indicator signals a possible sell.
Conclusion
The MFI indicator is one of the few technical indicators that take into account the volume of a bar when calculating values. We recommend using it as an additional support tool when building trading strategies. On our website, in the Strategies section, you can find examples of trading strategies using the MFI indicator.
Download the MFI indicator for MetaTrader 4 from the button below
Tip: Can’t open the downloaded archive file (ZIP or RAR)?
Try WinRAR for Windows or The Unarchiver for Mac .
Do you need help with installing this indicator into MT4 for Windows or Mac OS? Our guide HERE will help you.


