The Trend Risk indicator is a small system designed to determine the upcoming price level turns, as well as to identify the optimal points for opening positions. The main advantage of the indicator is not only the accuracy of the signals, but also the ability to trade both with a trend and a flat in the market .
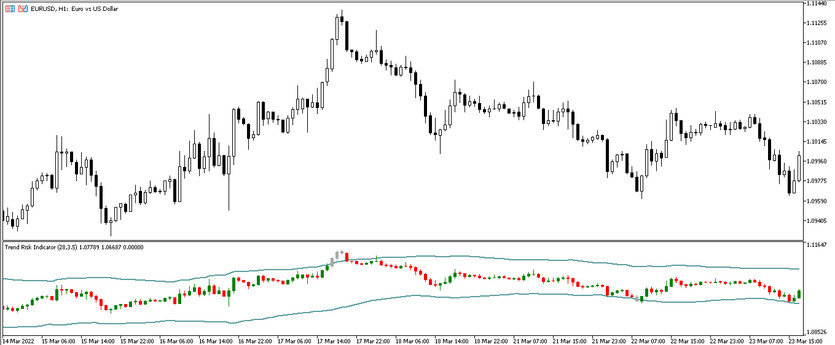
Trend Risk is represented on the chart in the form of bars of a certain color, as well as a channel consisting of curves. The indicator can be considered universal due to the ability to trade on any timeframe using any currency pairs.
Input parameters
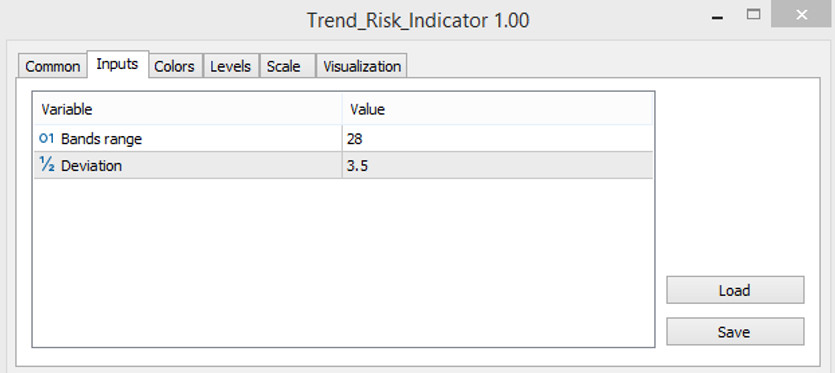
Despite the fact that the Trend Risk indicator performs complex calculations to identify trading points, there are only two parameters in its settings.
- -Bands range - parameter for setting curved lines of the indicator forming a channel. However, when changing this parameter, be sure to take into account the value of the selected timeframe. The default value is 28.
- -Deviation - deviation level of the indicator signals. The default value is 3.5.

Indicator signals
After making certain calculations, the Trend Risk indicator generates a signal, after receiving which a particular trade can be opened. It should be borne in mind that the trading method during trend detection may differ from trading during a flat.
Signals for Buy trades:
If the market determines the beginning of an uptrend:
- - The candle is painted in a neutral color, that is, it does not matter if it has growth or fall value.
- -It should be close to the upper curve line.
Close a long position, opened during the definition of a trend, should be when changing the color of the candle.
If a flat is determined on the market, then the conditions for opening a trade will be different. It should be definitely taken into account that trade cannot made when candles with a neutral color appear.
- -Candle is colored with growth value.
- -In this case, the candle should be inside the channel, between the lines.
Close the trade is when the color of the candle changes.
Signals for Sell trades:
Trading when determining the beginning of a downtrend is made if:
- - A bar with a neutral color was formed.
- -This bar should be closer to the lower curve line.
Accordingly, the trade is closed if the candle changes its color.
If the market is determined to be flat, then the candle should under no circumstances have a neutral color.
- -The candle must have a fall value.
- -It must also be between the two curves.
Close the trade during a flat should be when changing the color of the candle.
Conclusion
Trend Risk is a very accurate indicator that can be used even if there is a flat on the market. When using this indicator with additional tools, a win-win strategy can be created, that is, the chances of making a profit increase significantly.


