Price Action is one of the most popular methods that allows predicting which direction the price will go. The PA system is based on finding combinations of figures from Japanese candlesticks. The main advantage of Price Action patterns is that they have a high probability of successful trades.
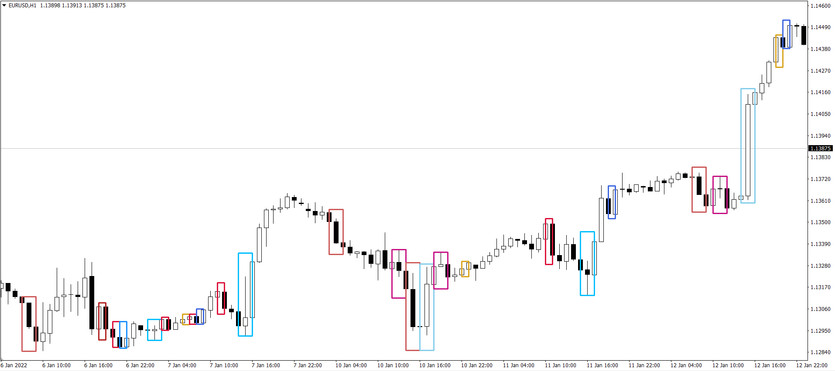
The Price Action Scanner indicator makes it easier for the trader to find and mark these patterns on the chart. This auxiliary algorithm determines the following types of patterns on the chart:
Pin Bar pattern (hammer, shooting star). Reversal pattern.
Rails pattern. Strong reversal pattern PA, which is clearly visible on the charts. It serves as a sufficient basis for opening an order. The probability that the pattern will work increases if the size of the candles on the rails is larger than those that preceded them.
Patterns TBH and TBL. Two or more equal high (TBH) or equal low (TBL) Japanese candlesticks mean that the resistance or support level that has formed such a pattern is under very serious pressure, and the chart can break it. TBH and TBL are medium strength reversal patterns.
The indicator also detects PPR and WRB patterns on the chart.
Indicator settings
The indicator settings allow to enable or disable the search for each of the patterns. Also, the following settings are displayed in the external parameters:
Valid deviation of Hi/Lo to equal, point — Permissible deviation in points at which high or low values of bars are considered equal (for DB and TB patterns);
Max. Candles Body Ratio, % — Maximum superiority of the bodies of one of the candles, in % (for the Rails pattern);
Ratio of Candles Body to It Height, % — Minimum ratio of the candle body to its height, in % (for the Rails pattern);
Affinity Close Price to Candle Hi-Lo, point — The proximity of the closing price to the minimum or maximum, in points (for a Pin Bar);
Minimum of Shadow to Body Candle Ratio — The minimum ratio of the candle's shadow to its body (for Pin Bar);
Minimum Part of Shadow Outsiding for Previous Bar, % — The minimum part of the shadow that protrudes beyond the previous bar, in % (for a Pin Bar).
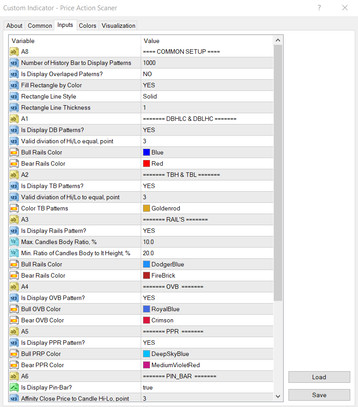
With the help of General Settings, you can:
Set the depth of history from where patterns will be searched (0 - all available history) - "Number of History Bar to Display Patterns".
Enable or disable overlapping patterns - "Is Display Overlaped Patterns?"
Enable or disable the fill of the rectangle with color - "Fill Rectangle by Color"
Select the line style of the rectangle if the fill is disabled - "Rectangle Line Style"
Select the line thickness of the rectangle - "Rectangle Line Thickness"
In order not to clutter up the chart, and at the same time, to understand where and what pattern is displayed, just hover the mouse pointer over the edge of the rectangle, after which a hint will appear, which will indicate the type of pattern (PPR, OVB, etc.), its direction (BULL_TYPE or BEAR_TYPE) and time of its formation.
Conclusion
Price Action strategies are widely used to successfully determine price action. When properly configured, the Price Action Scanner indicator, along with other confirmation filters, can help a trader build unique profitable trading systems.