The "Two_momentum" indicator introduced here is a trend capturing tool. Because it is a leading indicator, you can quickly see if a trend is occurring or not.
The indicator "Two_Momentum" for Metatrader 4 is perfect when you want to trade "momentum" crossovers.
Download the indicator for free at the bottom of this page.
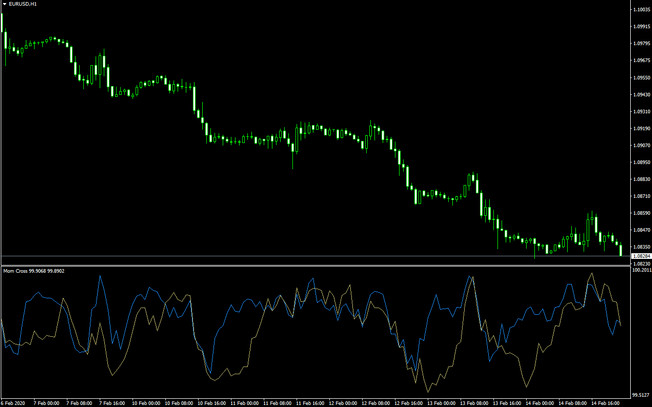
Example of displaying this indicator on the EuroDollar hourly chart
"Two_Momentum" draws short-term and long-term momentum lines in the sub-window. In the example above, the blue line is the short-term momentum and the yellow line represents the long-term momentum. This makes it easy to trade "momentum" crossovers.
Tips for use:
1. Analyzing the two momentums can be useful for market analysis.
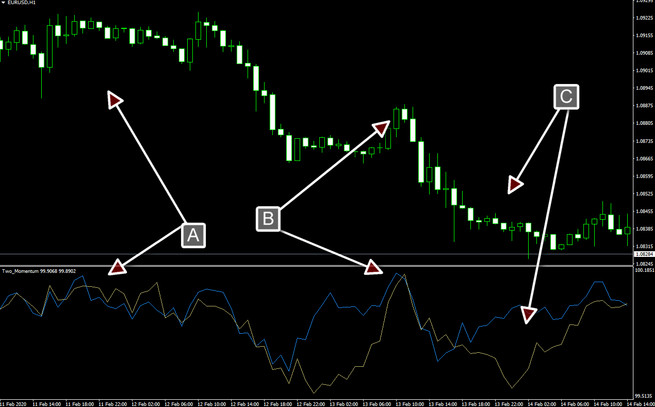
- For example, if both momentums are rubbing together, as in "A" in the image below, a strong range market may be occurring.
- If both momentums rise and fall sharply, as in "B", it is proof that strong price movements have occurred.
- On the other hand, when the distance between the two momentums is large, such as "C", it indicates a trend correction, a range market, and a reversal.

Momentum calculation period applies 5 and 14
2. Trade the crossover.
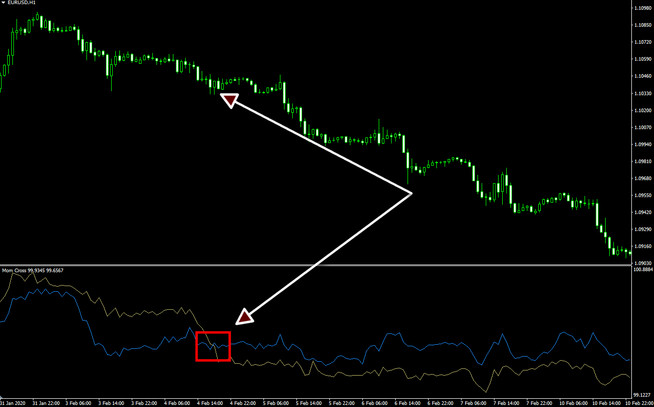
It is a good idea to trade the momentum crossover using the "Two_Momentum" indicator. In this case, it is better to use larger periods for the momentum calculations (20 and 50, etc.). For example, you can see that the short-term momentum crosses the long-term momentum downward in the red area in the image below. In this case, aim to place a sell order.

Momentum calculation period applies 20 and 50
Compatibility: MT4
Parameters:
- FastMom - The period used to calculate fast momentum
- SlowMom - The period used to calculate slow momentum
Download the "Two_Momentum" indicator from the button below
Tip: Can’t open the downloaded archive file (ZIP or RAR)?
Try WinRAR for Windows or The Unarchiver for Mac .
Do you need help with installing this indicator into MT4 for Windows or Mac OS? Our guide HERE will help you.


