
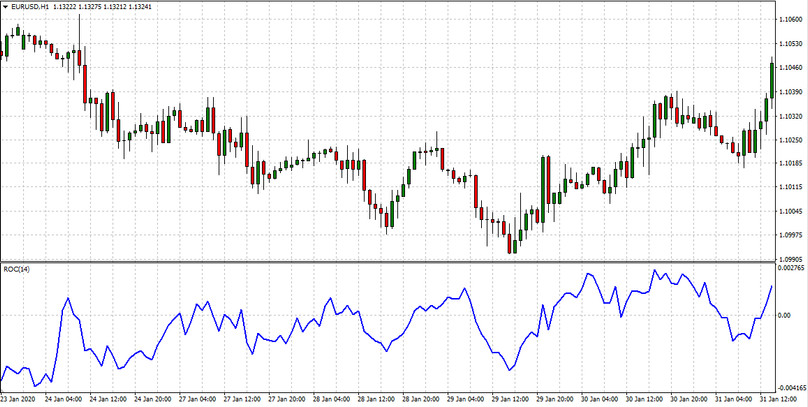
The Rate of Change indicator is an oscillator comparing today’s closing price with how the market closed a few days ago. Outwardly, it is very similar to the Momentum oscillator and is interpreted in exactly the same way.
This indicator is a tool to identify bursts of overbought and oversold, as well as bullish and bearish divergences.
Indicator calculations
The indicator of the rate of change in price can be applied to any timeframes, from hourly to monthly. It is calculated as the ratio of the current closing price to the same indicator for the previous period, which took place several segments ago:
ROC = (Pt / Pt – n) x 100%
The standard formula displays the growth in the value of the asset for the period in question. In addition, there is such a thing as a normalized RoC. It shows the profitability resulting from investments in a given asset for the same period. The most popular time frames are the ranges of 12 and 15 days. They are most convenient for medium and short-term trading.
Indicator settings
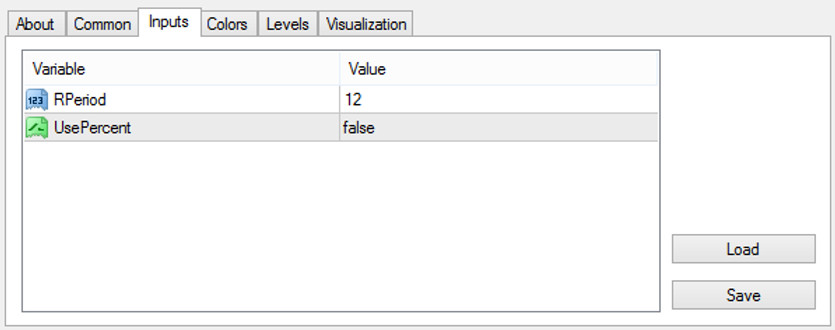
The following parameters can be set in the ROC indicator:
Rperiod is the number of periods for calculating the indicator values. As with any other Forex indicator, the lower this value, the higher the percentage of market noise the indicator will show.
UsePersent - indicator working method. Activating the TRUE parameter allows you to calculate the price change in percent
The false parameter is the calculation of the price change in points.
Indicator signals
The extreme ROC values indicate that it is unlikely that the trend will go much further without correction or consolidation. The bullish or bearish divergence is an additional indication that the current trend is losing its strength. When the price change rate indicator shows a bullish divergence in the oversold territory, closely monitor the buy signal provided by the prices; and when he shows a bearish divergence in the overbought territory, wait for prices to confirm that it’s time to sell.
When the oscillator reaches a new maximum, this suggests that the optimism of the market crowd is growing, and the rise is likely to continue. When the ROC drops to a new low, this indicates an increase in the pessimism of the crowd and the likelihood of a continued fall in prices in the future. When prices rise, and the ROC indicator falls, it warns you that the peak is close, and it is time to profit from held positions and tighten stops. When prices give a new high, and its maximum is lower than the previous one, the divergence of the bears gives a strong signal to sell. The opposite is true for a downtrend. The ROC indicator can be analyzed using classical technical analysis methods, which often gives proactive signals. A break in a trend line on a chart is often ahead of a similar break in a trend line in a price chart for a day or two. When you see that the trend line of the leading indicator is broken, get ready to break through the trend line on the price chart.
Conclusion
To achieve the desired frequency of signals and their proper quality, you will have to experiment with the indicator parameters. The selection should be based on the volatility of the currency pair, the higher the volatility, the longer the ROC indicator should be. Conversely, on a currency pair in which you can see long, lingering trends, you should use the ROC indicator with a short period. The advantages of the ROC indicator are obvious: it is easy to use, effective, and useful to everyone who uses technical analysis in their trading. It can be used both for intraday trading and in the long term.


