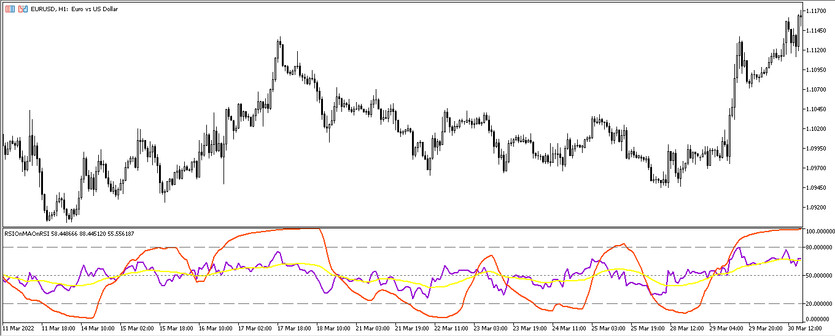
The RSI-MA-RSI indicator can be considered a small strategy based on a combination of RSI and MA indicators, the result of the calculation of these two indicators will be the search for the optimal point for opening a trade. And as a result, an indicator created to simplify trading conditions is obtained. RSI-MA-RSI indicator presented in the lower window of the price chart as three lines, RSI, RSI on MA and MA on RSI, with added levels of 20, 50 and 80.
Trading using the indicator can take place on any timeframe, since the indicator is multi-timeframe; currency pair can also be any that makes the indicator multi-currency.
Input parameters
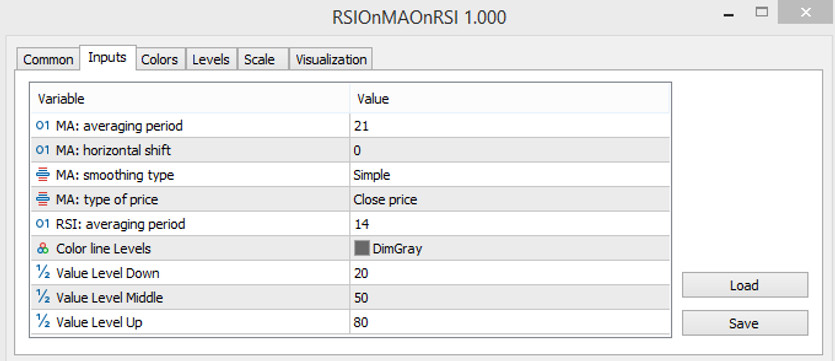
To reproduce the calculations of the RSI on MA on RSI indicator, nine parameters are required that are responsible for the separate functioning of the indicators on which the RSI on MA on RSI is based.
MA
- -Averaging period - the period of the moving average on which the indicator is based. The default value is 21.
- -Horizontal shift-horizontal deviation of the moving average. The default value is 0.
- -Smoothing type - moving average smoothing type. The default value is Simple.
- -Type of price - type of price to which the moving average calculations will be applied. The default value is Close price.
RSI
- -Averaging period-period for calculating bars by the RSI indicator. The default is 14.
- -Color line Levels - color of the level lines of the RSI indicator. The default value is Gray.
- -Value Level Down - the value of the lower level of the indicator, that is, the oversold zone. The default value is 20.
- -Value Level Middle - the value of the middle level of the indicator. The default value is 50.
- -Value Level Up - the value of the upper level of the indicator responsible for overbought in the market. The default value is 80.
In addition to the color of the indicator's level lines, the width and colors of other indicator lines can be changed in the RSI on MA on RSI settings.

Indicator signals
The signal of the RSI on MA on RSI indicator will be the intersection of the moving averages, taking into account the position of the RSI line with level 20, that is, the oversold zone, level 50 and level 80 - the overbought zone. After creating certain conditions on the candle, any trade may be opened.
Conditions for Buy trades:
- - The RSI line located in the indicator window crosses the level 50 from the bottom up, while it is important that it does not cross the level 80.
- - Under this condition, the RSI on MA line crosses the MA on RSI, so that the first is above the second.
After the appearance of such conditions on a certain candle, a long position is opened, which should be closed after the reverse intersection of the moving averages or after the RSI line passes the overbought zone.
Signal for Sell trades:
- -The RSI line, after crossing the level of 80, begins to move downward, crossing the level of 50. It is important that it does not reach the oversold zone, that is, level 20.
- -MA on RSI crosses RSI on MA from below upwards and is above it.
After all the conditions match on a certain candle, a short position can be opened. Such trade should be closed when the moving averages cross or level 20 is crossed by the RSI line.
Conclusion
The RSI-MA-RSI indicator is a small strategy formed on the basis of several indicators. Due to the presence of sufficiently advanced parameters, the indicator can be fully adapted to certain trading conditions. To achieve the desired trading results, not only careful money management is recommended, but also practice on a demo account.


