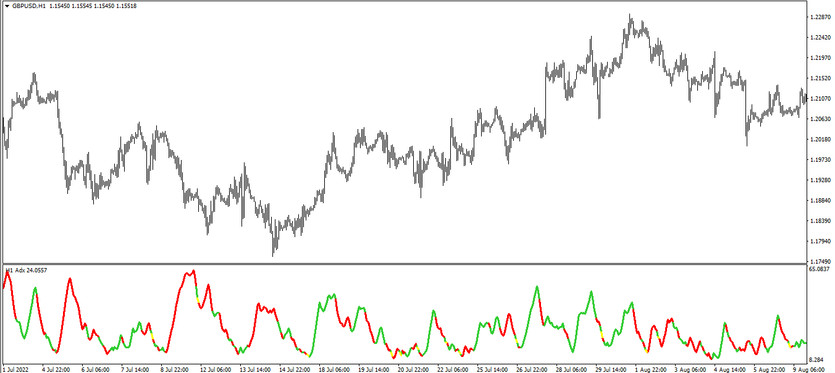
The ADX DMI Color is a modified and updated version of the ADX indicator, which is included in the standard Forex set. The modern version of the indicator differs from the standard one not only in accuracy in calculations, but also in a new, convenient visualization. As it is known, ADX itself is presented in the lower window of the price chart in the form three lines, one of which is the main one, and the remaining two are signal DMI. The ADX DMI Color version can be called more convenient in terms of visualization, since only one common line is displayed on the chart, which combines three. Despite the similarity in drawing indicators, their purpose is to determine the current trend and its strength, and at the same time, to find the optimal moment to open positions.
The ADX DMI Color indicator, like the ADX itself, can be used on any timeframe, with any currency pairs.
Input parameters
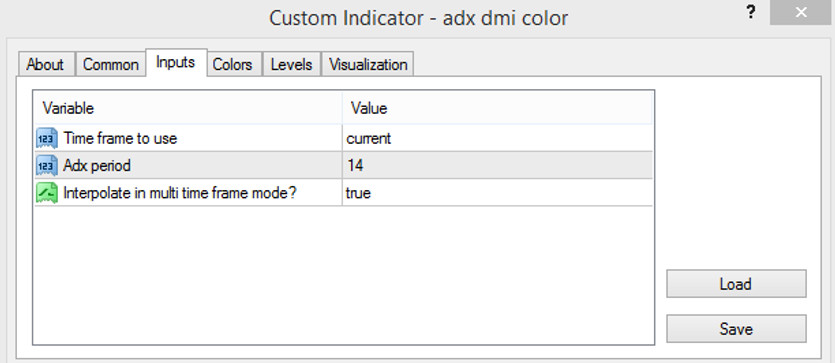
There are only three input parameters in the settings of the ADX DMI Color indicator, which are very easy to adjust to own trading method. In addition to the generally accepted parameters, there is a special parameter in the indicator settings that allows switching the indicator to multi-timeframe mode, which will allow trading on several timeframes simultaneously. Sections Colors in its settings are responsible for the color gamut and width of its line, and the Levels section is responsible for adding signal levels indicator to the window.
- Time frame to use is a parameter responsible for choosing a timeframe for trading. The default value is Current, that is, the timeframe already set on the chart.
- ADX Period - ADX indicator period. The default value is 14.
- Interpolate in multi time frame mode - parameter for switching the indicator to multi-time frame mode. The default value is true.

Indicator signals
The principle of operation and application of the indicator in practice is very simple and logical. If when trading with standard ADX it was necessary to wait and look for the intersection point of the lines, taking into account their location relative to each other and their color, then with the ADX DMI Color indicator everything is much simpler. Before opening positions, it should be just pay attention to the current color of the line and its direction, and close it should be subject to the same conditions. This line is built according to the indication of the ADX indicator, that is, at a certain intersection of its lines, the ADX DMI Color line acquires some color.
If the color with a growth value is an uptrend, if it is a downtrend with a falling value, and if it has a neutral hue, then the current trend begins to weaken and at this moment it should be stopped opening positions and close all current ones, since at this moment the trade is unlikely to be the most profitable.
Signal for Buy trades:
- The indicator line moves up, and at the same time it is colored with the growth value.
After receiving such a signal, a long position can be opened on a certain candle. It should be closed after a return signal is received due to a change in the color or direction of the line. In this case, the current trend weakens and it can be considered opening new positions.
Signal for Sell trades:
- The ADX DMI Color indicator, painted in the color of the fall, moves from top to bottom.
After the indicator line is in these conditions, a sell trade can be opened. Such a trade should be closed after the indicator receives the opposite conditions, that is, the color and direction of its line change. By this time, it is needed to be ready to open new positions.
Conclusion
The ADX DMI Color indicator is very efficient and easy to use, and is in no way inferior to its previous version, because in addition, it is very logical and convenient. In order to master all the necessary skills for using it, it is needed to study its standard version, be able to control its signals and a predetermined period to practice on a demo account.


