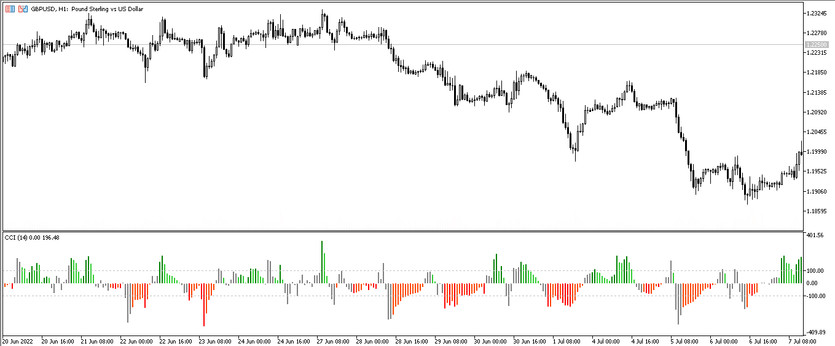
The CCI Draw Mode tool is an improved version of the standard CCI Forex indicator. But unlike the standard version, CCI Draw Mode is not only extremely accurate in its signals, but also very convenient in visualization. That is, there is a parameter in the indicator settings that is responsible for drawing the indicator on a chart in the form of a histogram with separate columns of five colors or completely filled with two colors, as well as in the form of a line.
Depending on own preferences, any of the three options can be selected. Due to this variety, the indicator can be used not only separately, but also as an additional tool in trading strategies that could confirm the entry point to the market, or determine the market exit to the overbought or oversold zone. In addition, the indicator has a Confirmation parameter, thanks to which the indicator signals will be carefully checked. The CCI Draw Mode indicator is suitable for use on any timeframe and currency pair.
Input parameters
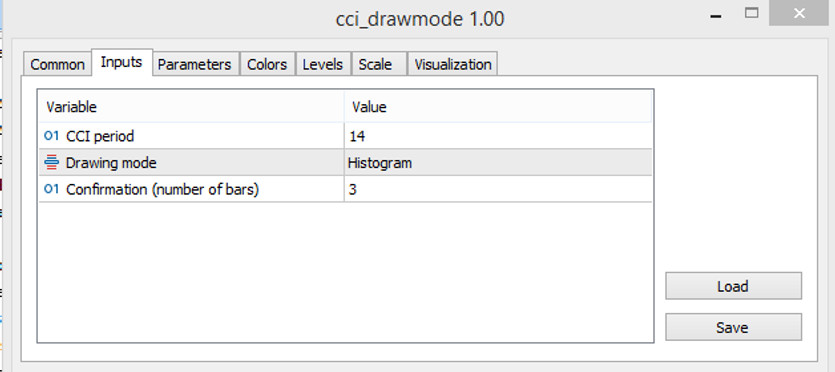
Despite the fact that the CCI Draw Mode indicator has only three parameters in its settings, it should be borne in mind that each of them plays an important role in the operation or visualization of the indicator itself. Therefore, before changing any parameter, it should be pay attention to the market reaction.
- CCI Period - technical CCI period, which is the basis of the indicator. The default value is 14.
- Drawing mode - parameter responsible for visualizing the indicator on the chart. The default value is Histogram. It should be taken into account that the choice of any of the visualization options will not affect the overall operation and effectiveness of the indicator.
- Confirmation (number of bars) - parameter responsible for the number of confirmed bars. The default value is 3.

Indicator signals
The signals of the CCI Draw Mode indicator should be considered based on the selected option in the Drawing mode parameter settings. At the same time, the principle of operation for each of them is very similar. If the Histogram value was selected, then signals for opening positions will be considered when several columns are colored in a certain color, taking into account their direction. When choosing this value, it is very important not to trade when the histogram is colored in a neutral color, this indicates the absence of any trend in the current market. If the Color fill value was chosen, then the signal is considered taking into account the color and location in relation to to level zero, and if the Line value is selected, it should be followed the direction of the line and the intersection of levels 100 and -100 by the line.
Signal for Buy trades:
If Histogram is selected:
- Histogram bars should be colored with the growth value, while crossing the zero level from the bottom up. On the current candle, the bars should acquire a darker shade with the growth value.
Upon receipt of such conditions, a long position may be opened on a certain candle, which should be closed after the histogram bars acquire a lighter shade of growth value or turn into a color with a fall value, this indicates a weakening or end of an uptrend and in this case it is better to consider new deals.
If Color fill is selected:
- The histogram must be above the zero level, that is, it is colored with a growth value.
After the histogram crosses its zero level upwards, a buy trade can be opened, which should be closed after it crosses this level back.
If Line is selected:
- The indicator line should go up, crossing levels -100 and 0, but it is important that it does not cross the threshold of level 100.
After the line crosses the zero level upwards, a long position can be opened, which should be closed after the line changes direction or breaks through the 100 level upwards.
Signal for Sell trades:
If Histogram is selected:
- The histogram should acquire a color with a fall value when crossing the zero level from top to bottom. At the same time, on the signal candle, the bars should acquire a darker shade with a fall value.
After receiving such conditions, a sell trade can be opened on a certain candle, which should be closed after the histogram bars acquire a lighter shade with a fall value or turn into a color with an increase value, which will indicate the end or weakening of the downtrend.
If Color fill is selected:
- The indicator's histogram should drop below its level zero, with a color with a drop value.
After the histogram crosses the zero level down, a sell trade can be opened. It should be closed after it crosses this level back.
If Line is selected:
- The indicator line should fall below levels 100 and 0, moving down to level -100, but not reaching it.
After the line falls below the zero level, a short position can be opened, which should be closed if the line falls below the -100 level or changes direction and starts moving up.
Conclusion
CCI Draw Mode is a very interesting indicator, which allows choosing its convenient drawing on the chart. And despite the chosen visualization, the indicator does not lose its effectiveness and even shows good results on all timeframes. However, in order to study and fully understand all three indicator visualization options, it is recommended practice on a demo account.


