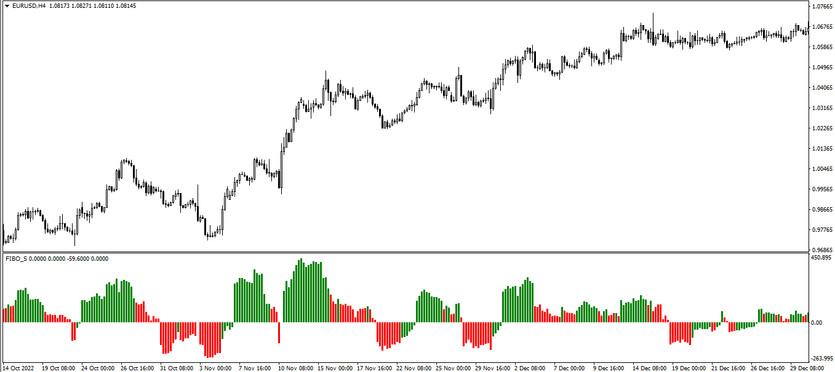
The Fibo S is a trading algorithm based on a technical analysis tool called Fibonacci Levels. This indicator was created to determine the direction of the current market movement, to identify its strength and determine support and resistance levels. This information about the current market, in turn, will allow to easily and quickly determining the right moment to enter the market. The Fibo S indicator is presented in the lower window of the price chart in the form of a histogram, the current trend depends on the color and direction, and its strength depends on the size of the columns. In addition, the indicator settings can include parameters that display Fibonacci levels, high and low levels, as well as the estimated price target in the chart window.
The Fibo S indicator is suitable for use on any timeframes, with any currency pairs.
Input parameters
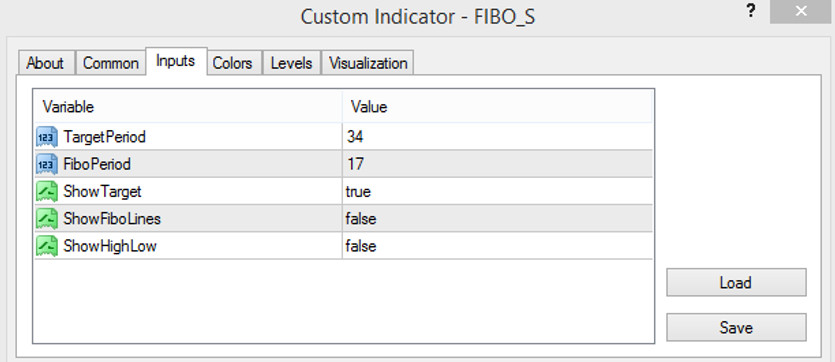
The input parameters of the Fibo S indicator consist of five points, each of which is directly related to the operation of the indicator. The Colors section in its settings is used to change the thickness and color scheme of the indicator, and the Levels section is used to add signal levels to its window, which is especially convenient for building own trading strategy.
- TargetPeriod - indicator target calculation period. The default value is 34.
- FiboPeriod - value of the Fibonacci levels indicator. The default value is 17.
- ShowTarget - parameter responsible for displaying the proposed price target on the chart. By default, it is set to true.
- ShowFiboLines - parameter responsible for the presence of Fibonacci lines on the chart. The default value is false.
- ShowHighLow - parameter for displaying High and Low levels on the chart. The default value is false.

Indicator signals
The concept of using the Fibo S indicator is very simple, since the method of its application, despite the way the calculations are reproduced, is absolutely identical to other histogram indicators. That is, the current market trend, taking into account which a trade is opened, is determined using some indicator factors. Namely, using color and the location of the histogram bars relative to level 0, while their size will indicate the strength of the current trend. And thus, if the trend is up, long positions are opened, if the trend is down, short positions are opened.
Signal for Buy trades:
- At least three columns of the histogram have a color with a growth value and are located above level 0. At the same time, with each column, their size increases.
Upon receipt of such conditions, a buy trade can be opened on a signal bullish candle, due to the presence of an uptrend in the market. Such a trade should be closed after at least one indicator bar drops below the 0 level, and before that the histogram acquires a different color. At this moment it should be prepared for a change in the current trend and the opening of new trades, respectively.
Signal for Sell trades:
- At least three bars of the histogram must be below level 0 and have a color with a falling value. In addition, each new bar must be lower than the previous one.
Upon receipt of such a combination of conditions, a sell trade can be opened on a signal bearish candle with a strong downtrend. It is recommended to close the trade after at least one bar of the histogram rises above the 0 level, before that, the histogram will change its color. At this point, it should be considered opening of new trades, caused by a change in the current trend.
Conclusion
The Fibo S indicator is a very effective indicator, thanks to which it can be known all the necessary information about the current market. Sometimes there may be some inaccuracies in the indicator, which can be corrected by using additional indicators, tools or filters. The indicator is very easy to use, and therefore suitable even for beginners who can strengthen their skills with preliminary practice on a demo account.
You may also be interested The TSI MACD Trading Indicator for MT4


