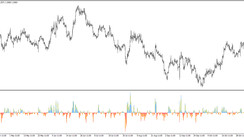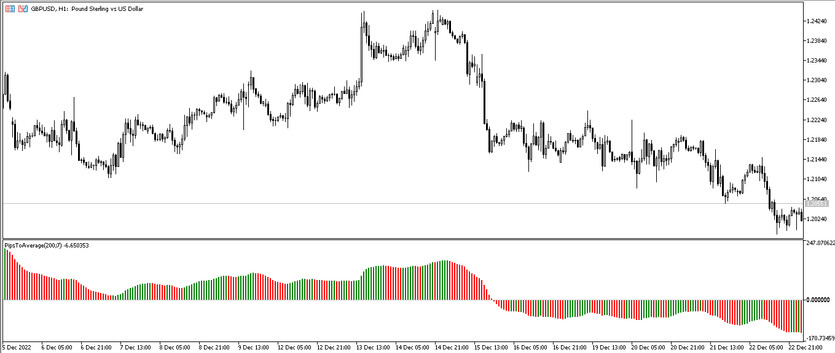
The Pips to Average indicator is a special trading algorithm, the calculations of which are based on measuring the distance between the closing price and the moving average. In its calculations, the indicator uses two moving averages at once: Exponential and Smoothed. These calculations are used exclusively for trading during a certain market trend, that is, any trade is opened taking into account the direction of the current market movement. The indicator itself is presented in the lower window of the price chart in the form of a histogram,the columns of which have a certain color and are located above or below the signal level 0. Thus, the current trend is determined precisely by these indicator values, which in turn also determine the direction of the trade.
The Pips to Average indicator works equally effectively when choosing any currency pairs or timeframes.
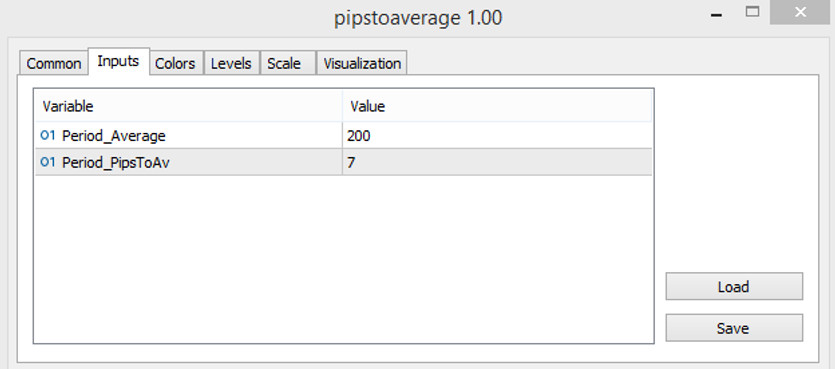
Input parameters
The Pips to Average indicator settings consist of several sections. The input parameters that affect the technical operation of the indicator consist of only two points, but this does not make the indicator less effective. The Colors section is responsible for the color scheme and thickness of its values, and the Levels section is for adding into its signal levels window.
- Period Average - the period of the exponential moving average used as the basis for the indicator's calculations. The default value is 200.
- Period PipstoAv - the period of the smoothed moving average calculated at the closing price. The default value is 7.
Indicator signals
The algorithm for using the Pips to Average indicator is very simple, since it is identical to using similar histogram indicators. To open a certain trade, the current one is determined first. To determine it, it is just needed to take into account the color and location of the current histogram columns relative to the signal level 0. And if the current trend is upward, buy trades should be opened, while if the trend is downward-sell trades.
Signal for Buy trades:
- The histogram of the indicator is colored with the growth value, after which it rises above the 0 level.
Upon receipt of such conditions, a long position may be opened on a signal bullish candle due to the presence of an uptrend in the market. It should be closed after the indicator histogram changes its color or direction. At this moment, a change or weakening of the current trend should be expected, which in turn will allow considering the opening of new positions.
Signal for Sell trades:
- Histogram bars are colored with the growth value, after which they fall below the signal level of the indicator.
A short position can be opened on a bearish candle immediately after receiving conditions that characterize a downtrend in the market. Such a position should be closed immediately after at least one column of the histogram changes its color or direction. At this moment, it should be prepared to open new trades due to a possible change in the current trend.
Conclusion
The Pips to Average indicator is indeed a very effective trading algorithm, since it is based on time-tested indicators. To get the best results of using the indicator, it is recommended to use additional filters, tools or indicators, but its separate use is not denied. In order to learn how to use this indicator correctly trading algorithm and get the necessary trading skills, preliminary practice on a demo account is recommended.
You may also be interested The Smoothed Smart Money Pressure Oscillator for MT5