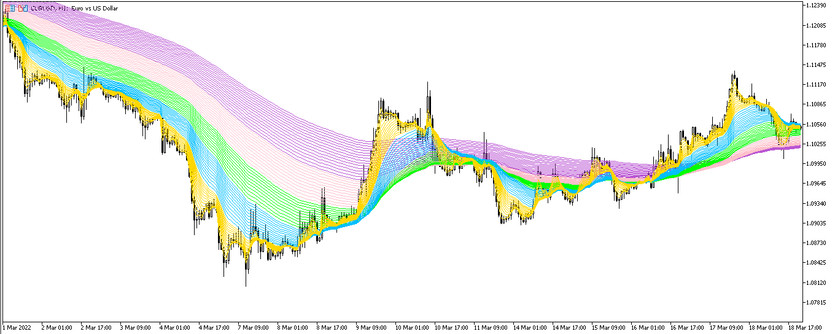
The RMMA is a trading indicator, which is an algorithm based on the functioning of 66 moving averages with different periods. The main task of the indicator is to determine the current trend and its strength, and, depending on it, open trades in the direction of the trend. Due to the presence of a large number of moving averages in the indicator, RMMA is able to determine both short-term and long-term trend changes.
The indicator is represented on the chart in the form of multi-colored moving averages, which, under certain conditions, are grouped, or vice versa, diverge. The indicator can work equally accurately on any timeframe , using any currency pair.
Input parameters
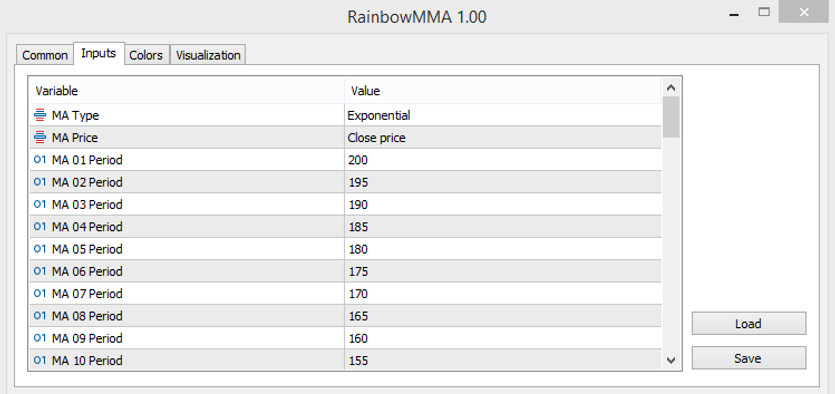
In the settings of the RMMA indicator, due to the fact that it is presented in the form of 66 moving averages, there are almost the same number of input parameters, which are mainly based on the parameters responsible for their period, which, starting from 2, increases to 200, there are also two common parameters, which are responsible for the type of smoothing of the moving averages and the price to which their calculations will be applied.
- MA Type - type of smoothing of all moving averages included in the indicator. The default value is Exponential.
- MA Price - the price to which the indicator calculations will be applied. By default, it has the Close price value.
- MA Period - period of 66 moving averages, starting from the fastest, which has a default value of 2, and ending with the slowest, with a value of 200.
Also, in the indicator settings, the color scheme and thickness of all 66 moving averages can be completely changed at own discretion.

Indicator signals
The moving averages of the RMMA indicator, displayed on the price chart, are divided into 5 groups depending on their period, starting from fast moving averages, that is, with a small period, ending with slow ones, that is, with a long period. To determine the current market trend, it should be monitored the location relative to each other fast and slow moving averages, and to find out the strength of the current trend, it should be pay attention to the distance between the lines. If the lines are located at a distance from each other, then the trend is strong, and if the lines merge and form one solid line, then the current trend is weak.
Signal for Buy trades:
- Moving averages are located on the chart so that the slow ones are under the fast ones, this indicates the beginning of an uptrend.
- At the same time, all moving averages should be located at a certain distance from each other, this indicates the strength of the current trend.
With such an intersection of the moving averages on a certain candle, a long position is opened, which should be closed after the direction of the moving averages changes or they form a solid line.
Signal for Sell trades:
- A downtrend is determined in the market, which is characterized by the intersection of the moving averages, in which the slow ones turned out to be higher than the fast ones.
- At the same time, all moving averages should be separate from each other, this will indicate a strong trend.
After receiving such conditions, a short position can be opened on a certain candle. It should be closed after combining all the moving averages into a solid line or after the reverse crossing of the moving averages.
Conclusion
The RMMA indicator is a fairly accurate and powerful tool that helps to determine not only the current trend, but also its strength. Due to the large number of moving averages on one chart, the indicator easily determines not only long-term, but also short-term market movements, indicating the optimal point for opening positions. But before using the RMMA indicator in practice, a preliminary study of its nuances on a demo account will be required.


