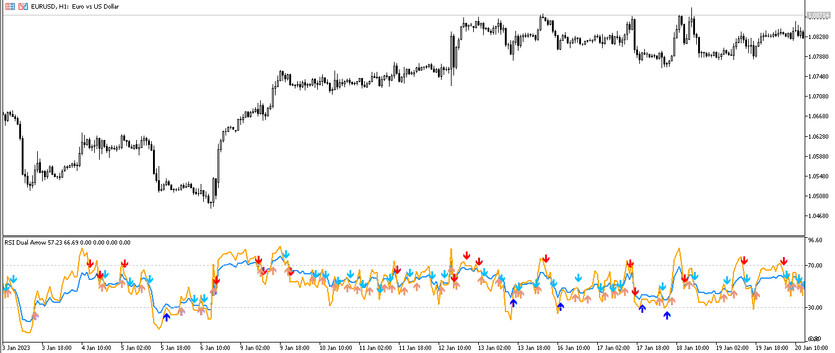
RSI Dual Arrow is a modified and improved version of the effective Forex RSI indicator included in its standard set. The indicator, like its standard version, can be used to determine the current market trend and open trades during this period, while also suitable for determining the market in the overbought zone or oversold. At the same time, not only the current trend is highlighted in the indicator window, but also the moment at which it is needed to open and close a trade. Thus, this trading algorithm is not only very effective, but also easy to use. It is displayed in the lower window of the price chart in the form of two intersecting lines, at the moment of their intersection an arrow appears, the direction and color of which will determine the opening or closing of trades.
The RSI Dual Arrow indicator is suitable for any timeframe and currency pair.
Input parameters
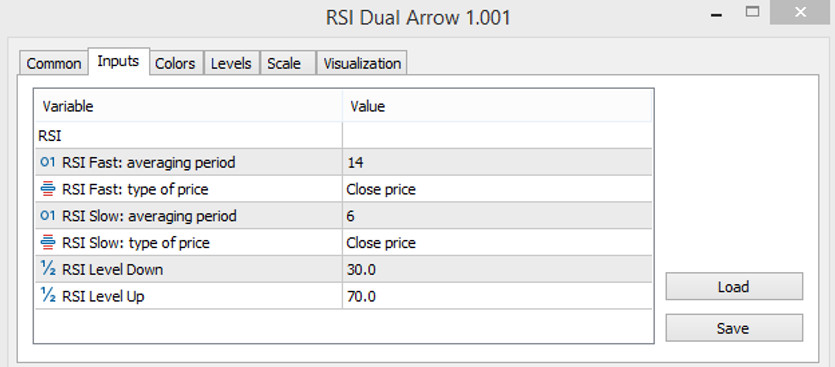
The settings of the RSI Dual Arrow indicator consist of several sections. Thus, the Input Parameters section is used to change some values that affect its technical operation. The Colors section is used to change the color scheme and thickness, and the Levels section is used to add signal levels to the indicator window.
- RSI Fast:averaging period - calculation period of the indicator's fast line. The default value is 14.
- RSI Fast:type of price - price type used to calculate the indicator's fast line. Close price by default.
- RSI Slow:averaging period - value of the period of the slow RSI line. The default value is 6.
- RSI Slow:type of price - price type used in slow RSI calculations. Close price by default.
- RSI Level Up - the upper signal level of the indicator, which is responsible for overbought conditions. The default value is 70.
- RSI Level Down - the lower oversold level of the indicator. The default value is 30.

Indicator signals
The algorithm for using and applying the RSI Dual Arrow indicator is extremely simple. To open a certain trade, it is only needed to take into account some parameters that determine the current trend, namely the intersection of the indicator lines, as well as the color and direction of the arrow that appears during this intersection. And thus, if the conditions indicate on an uptrend, buy trades are opened, and if the trend is down, sell trades. Trades should be closed according to the same principle, that is, when the indicator lines cross or when another arrow appears.
Signal for Buy trades:
-The lines of the indicator intersect so that the fast one is higher than the slow one. And at the place of their intersection, an upward arrow appears and has a color with a growth value.
Upon receipt of such conditions, a buy trade can be opened on the signal candle, due to the presence of an uptrend in the market. It should be closed after the indicator lines intersect again and an arrow of a different color and direction appears in their place. At this moment, a change in the direction of the trend is possible, which will allow considering the opening of new trades.
Signal for Sell trades:
-After crossing, the lines are positioned so that the slow one is higher than the fast one. At the place of their intersection, an arrow should appear, colored in color with a falling value, pointing down.
A sell trade, due to the presence of a downtrend in the market, can be opened immediately on a signal candle when such conditions are received. Such a trade should be closed when the opposite conditions are received, namely, when the lines intersect again and an arrow of a different color and direction appears. At this moment, it can be considered opening of new trades, caused by a change in the current trend.
Conclusion
RSI Dual Arrow is a very accurate and useful algorithm that is an improved version of an already effective indicator. Moreover, it is very easy to use and suitable even for beginners. In order to gain the necessary trading skills and the ability to correctly use the indicator, preliminary practice on a demo account is recommended.
You may also be interested The Range Oscillator Bands Trend trading indicator for MT5


