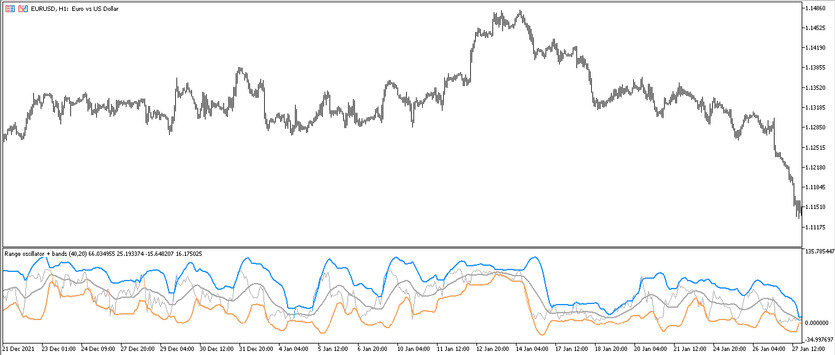
The Range Oscillator Bands is a developed trading algorithm based on the functioning of two effective indicators Range Oscillator and Bollinger Bands. The indicator was created to determine the current market trend and open certain trades in this period. It is represented in the lower window of the price chart in the form of four lines: a namely three Bollinger Bands and one Range Oscillator line. All indicator lines intersect each other and move in a certain direction. And it is these indicator factors that serve as the main ones in trading to determine the current trend and trade during this period.
Trading using the Range Oscillator Bands indicator can be made with any currency pairs, on any timeframes.
Input parameters
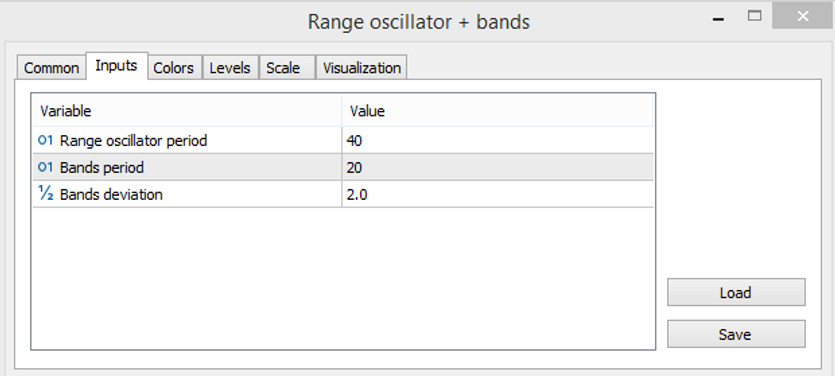
The input parameters of the Range Oscillator Bands indicator consist of only three input parameters, each of which affects its technical operation. Their values can be changed to adjust to own trading, taking into account the selected currency pair and timeframe. The Colors section in its settings is used to change the color scheme of its values, and the Levels section to add signal levels to its window.
- Range oscillator period - value of the period of the Range Oscillator indicator. The default value is 40.
- Bands period - period of the Bollinger Bands indicator. The default value is 20.
- Bands deviation - the current deviation of the Bollinger Bands values from the standard. The default value is 2.0.

Indicator signals
The Range Oscillator Bands indicator is used to trade with the trend. Therefore, before opening a certain trade, the direction of the current market movement is first determined. To do this, one should take into account the color, direction of the indicator lines and their intersection with each other. If the indicator defines an uptrend, buy trades are opened, and if the trend is down, sell trades. Trades opened with the Range Oscillator Bands indicator should be closed when the current trend changes.
Signal for Buy trades:
- The Range Oscillator line moves up, rising above the middle line of the Bollinger Bands, crossing the upper border and turning into a color with a growth value.
When a full combination of conditions is received, a buy trade can be opened on a signal bullish candle, due to the presence of an uptrend in the current market. Such a trade should be closed after receiving the opposite conditions, namely, when the direction of the lines changes and their new intersection. At this moment, a change in the current one is expected trend, which will allow considering the opening of new trades.
Signal for Sell trades:
- The indicator lines are moving down. The Range Oscillator line falls below the lower limit of the Bollinger Bands, turning into the color with the falling value.
A sell trade can be opened immediately on a signal candle upon receipt of such conditions. It is recommended to close it when the current trend changes, namely after the next intersection of the lines or when their general direction changes. At this moment, it should be prepared to open new trades.
Conclusion
The Range Oscillator Bands indicator is a very efficient and accurate trading indicator that provides the necessary information about the current trend to open certain trades. To improve the quality of the indicator, it can be used with additional filters, advisers or indicators. It is recommended to use a demo account before trading on a real deposit.
You may also be interested The STARC Bands trend trading indicator for MT5


