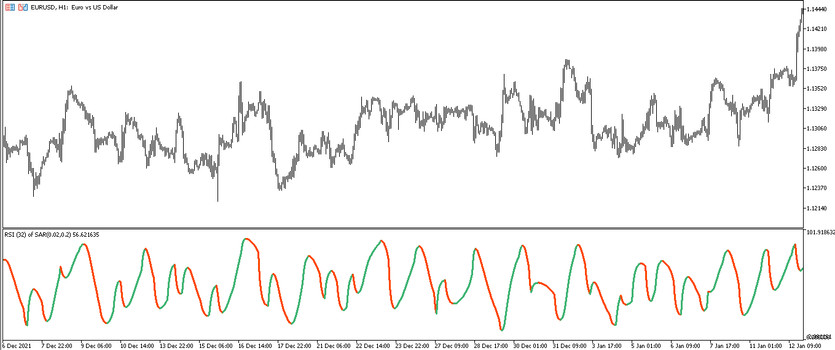
The RSI of Parabolic SAR is a trading algorithm based on the functioning of the calculations of two effective indicators included in the standard Forex set. The RSI of Parabolic SAR indicator can be used in trading to determine the current trend and its strength in the current market, which in turn will also allow determine the moment of opening trades. The indicator is presented in the lower window of the price chart as a solid line, which during a certain trend is painted in one of two colors, which in turn characterize an upward or downward trend, which in the future allows considering opening positions in their direction.
The RSI of Parabolic SAR indicator can be used on any timeframe with any currency pair.
Input parameters
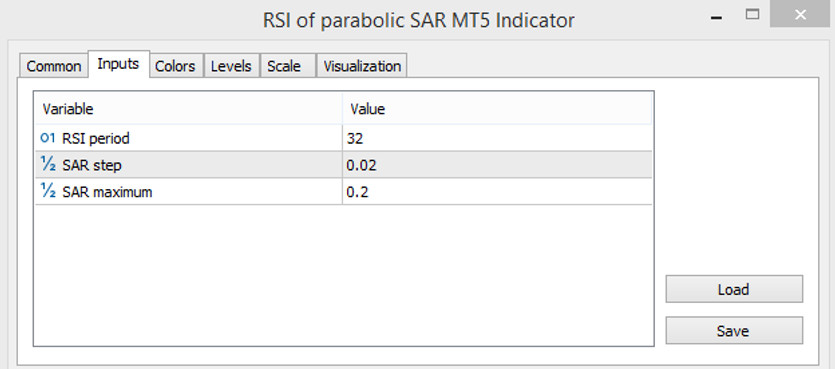
The settings of the RSI of Parabolic SAR indicator consist of three input parameters, it should be taken into account that each of them affects the overall functioning of the indicator, therefore, their values should be changed taking into account the operation of the indicator. The Colors section in its settings is used to change its color scheme and general visualization, and the Levels section for adding signal levels to the indicator window.
- RSI period - value of the period of the RSI indicator. The default value is 32.
- SAR step - step of the Parabolic SAR indicator. The default value is 0.02.
- SAR maximum - the maximum value of the Parabolic SAR indicator. The default value is 0.2.

Indicator signals
The signals of the RSI of Parabolic SAR indicator are calculated to determine the current trend and find the optimal moment to enter the market. This is done by taking into account the direction and color of the indicator line. As soon as the indicator line turns into a color with a growth value and starts to go up, an uptrend is determined and buy trades can be opened, and if the indicator line moves down and at the same time has a color with a fall value, then the current trend is down and sell trades can be opened.
Signal for Buy trades:
- The indicator line moves up and has a color with the growth value.
Upon receipt of such a condition, a buy trade may be opened on the signal candle, due to the presence of an uptrend in the market. Such a trade should be closed upon receipt of the opposite conditions, namely, when the color and direction of the line change. This may indicate a change in the current trend, which in turn will allow to consider the opening of new trades.
Signal for Sell trades:
- The indicator line, colored with the falling value, starts moving down.
A sell trade should be opened immediately upon receipt of such conditions on a signal candle, since their presence will characterize a downward trend. The trade should be closed after the indicator line changes direction and turns into a different color. At this moment, it should be prepared to open new trades, caused by a change in the current trend.
Conclusion
The RSI of Parabolic SAR indicator is a very good trading algorithm, due to the fact that its calculations are based on the use of two effective indicators, which has been proven by time. At the same time, the indicator is also very easy to use, as it can be seen with preliminary practice on a demo account.
You may also be interested The FTNP Trading Indicator for MT5


