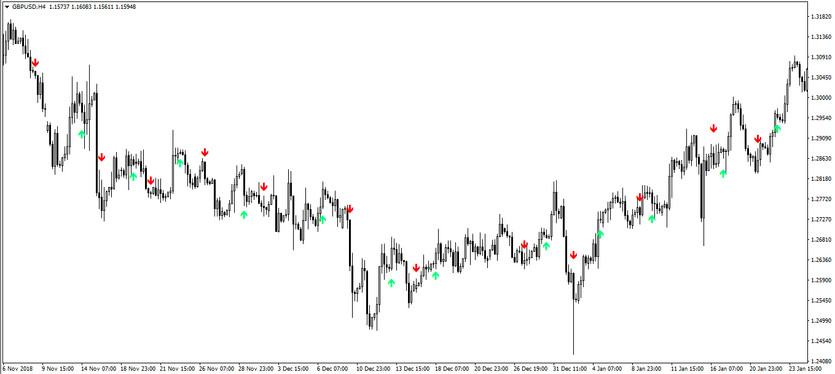
The SMA Crossover is a small algorithm that is used to find the optimal moment to enter the market by crossing moving averages. The indicator consists of two moving averages, one of them is fast, that is, with a smaller period, and the second is slow, that is, with a large period value. Upon receipt of certain market conditions, these moving averages change their movement as a whole or relative to each other, after which, at the place of their intersection, the indicator draws an arrow of a certain color and direction on the chart. Thus, taking into account the values of two moving averages, the SMA Crossover indicator generates signals for opening positions.
The SMA Crossover indicator is suitable for use on any convenient timeframe and with any currency pair.
Input parameters
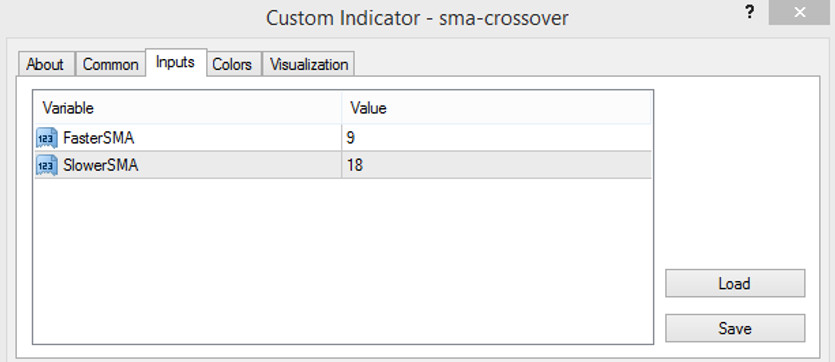
The SMA Crossover indicator is considered very easy to use also due to the presence of a small number of input parameters that are easy to set. There are two of them in its settings, not including the Colors section, which is responsible for the color scheme and size of the drawn arrows.
- Faster SMA - parameter responsible for the value of the fast moving indicator. The default value is 9.
- Slower SMA - slow moving SMA period. Default value is 18.

Indicator signals
SMA Crossover is a very easy to use indicator. It generates a signal when its two moving averages cross each other. An arrow with an growth value appears on the chart when the fast moving average crosses the slow moving average from the bottom up, and if an arrow with a falling value appears, then the slow moving average will be above the fast one. Thus, taking into account the color and direction of the arrow, a certain position can be opened.
Signal for Buy trades:
- Under a certain candle, a color arrow with a growth value is formed, directed upwards.
After an arrow appears on a certain candle, a long position can be opened on the candle after it. It is worth closing it if a new arrow appears on the chart, since in this case it can be considered opening new positions.
Signal for Sell trades:
- At the top of a certain candle, an arrow is formed with the value of the fall, which goes down.
After receiving such a condition, a sell trade can be opened on the candle after the signal one, which should be closed after the next candle appears on the chart, which will make it possible to open new positions.
Conclusion
The SMA Crossover indicator is not only simple, but also effective in use due to the use of moving average calculations, which are very often used in trading. The indicator is suitable for trading alone and in combination with other indicators, which will confirm the signal to open a position. Despite that the indicator is really easy to use, practice on a demo account will help cope with all the nuances in trading.


