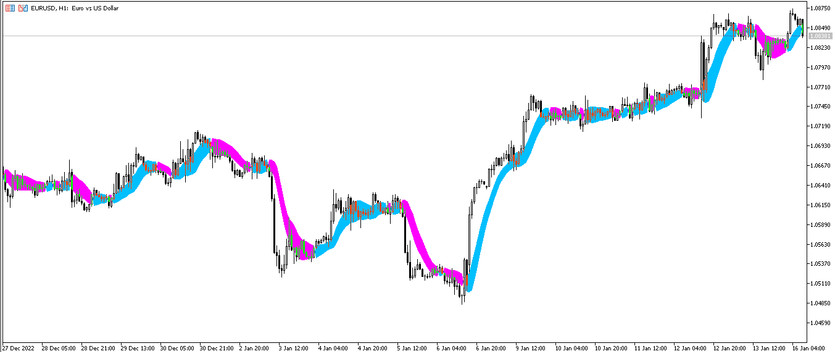
The SSL Channel Chart is a special algorithm that is used for trend trading. That is, all indicator calculations are aimed at determining the current market movement and opening a specific trade during this period. The indicator is suitable for both long-term and short-term trading, while In any case, before opening a certain position, the current trend is determined. The SSL Channel Chart is displayed directly on the price chart in the form of modified moving averages, the color and direction of which serve as the main indicators of the current market trend. At the same time, each trend and the opening of a trade must be confirmed by a notification from the indicator.
The SSL Channel Chart indicator works equally effectively on any timeframes, with any currency pairs.
Input parameters
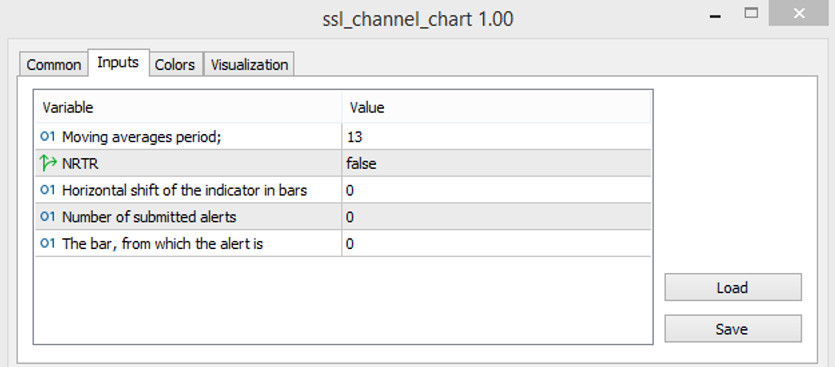
The SSL Channel Chart indicator settings consist of several sections. For example, the Input Parameters section, which consists of five items, serves to change some values and functions related to its technical work. While the Colors section only serves to slightly change its visualization, that is, the colors and thicknesses of its values.
- Moving averages period - the period of moving averages taken as the basis of the indicator. The default value is 13.
- NRPR - parameter responsible for using the NRPR indicator. The default value is false.
- Horizontal shift of the indicator in bars - shift of the current values of the indicator bars from the standard ones in horizontal. The default value is 0.
- Number of submitted alerts - number of notifications sent when an alert is received. The default value is 0.
- The bar from which the alert is - the number of the bar on which the alert is played. Default value is 0.

Indicator signals
Using the SSL Channel Chart indicator in practice is very simple. To open a certain trade, first, with the help of some factors and the signal of the indicator, the current trend is determined. To determine it, the color and direction of the current moving average, as well as its intersection with the current candle, are taken into account. Thus, if an uptrend is detected, buy trades are opened, while if the trend is down, sell trades are opened. In this case, in any case, the current trend is confirmed by a signal coming to the main window of the price chart.
Signal for Buy trades:
- The moving average, color-coded with growth value, should move from bottom to top.
Upon receipt of such a condition, on a candle that closes above the moving average, while crossing it, a long position can be opened, due to the presence of an uptrend in the market. This, in turn, should be confirmed by the indicator signal. Close the position immediately after the moving average will turn into a different color. At this moment, the opening of new trades, due to a change in the current trend, can be considered.
Signal for Sell trades:
- An indicator whose moving average has a color with a falling value should go from top to bottom.
A sell trade, due to the presence of a downtrend, can be opened immediately upon receipt of such conditions, on a candlestick that crosses the moving average and closes below it. The opening of the current trade must be confirmed by the indicator signal. It is recommended to close such a trade after the moving average turns into a different color, since this factor is an indicator of a change in the current trend, which in turn will allow considering the opening of new trades.
Conclusion
The SSL Channel Chart is a very effective trading algorithm that allows determining important information about the current market, which in turn provides for determining the trend and opening trades in its direction. It is very simple and easy to use, as it can be seen in the preliminary practice on the demo account.
You may also be interested The ADX Cloud trading Indicator for MT5


