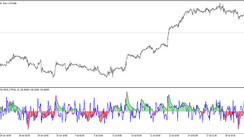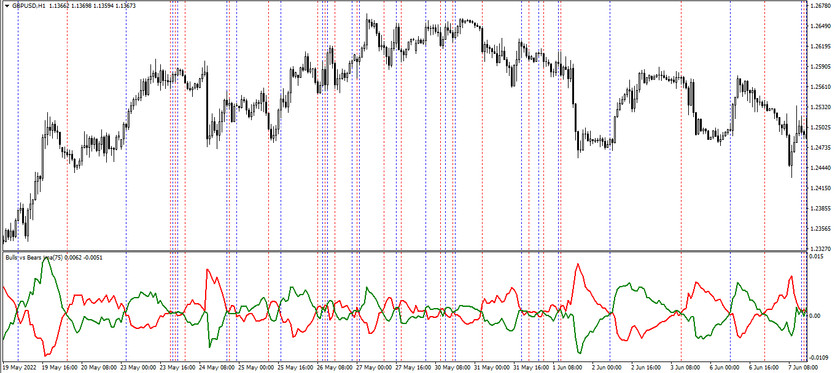
The Bulls vs Bears JMA Lines is an indicator that is often used in trading to identify the current trend and its strength at a certain moment. The indicator is presented in the lower window of the price chart as two lines, one of which is responsible for a bullish trend, that is, an uptrend, and the second is due to a bearish trend, a downtrend. Under certain market conditions, these lines begin to cross each other and at a certain moment, one of them turns out to be higher than the second, and this can be considered as an indicator signal that notifies about the dominance of a certain trend over the second and depending on this, a certain position may open.
The indicator is suitable for both long-term and short-term trading, so the timeframe can be any, like a currency pair.
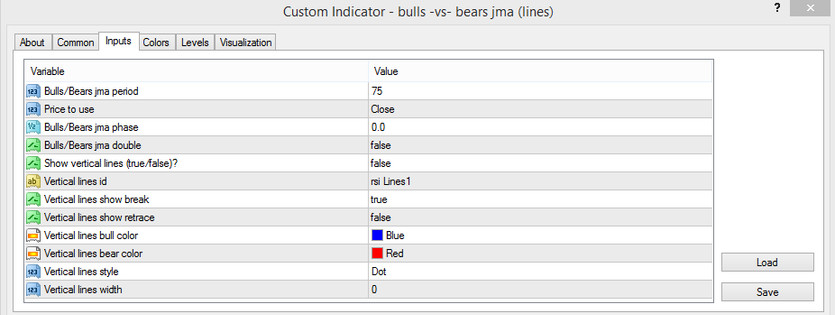
Input parameters
The Bulls vs Bears JMA Lines indicator has fairly advanced parameters in its settings, which to a certain extent affect both its technical operation and external visualization, so it is recommended to carefully study all the input parameters before changing its settings.
- Bulls/Bears jma period - period of the Bulls and Bears indicator. The default value is 75.
- Price to use - the price to which the indicator's calculations will be applied. The default value is Close.
- Bulls/Bears jma phase - period of the indicator phase. The default value is 0.0.
- Bulls/Bears jma double - parameter responsible for using the indicator's double value. By default, it has the false value.
- Show vertical lines - parameter responsible for the presence of vertical lines on the chart, which are formed during the period of intersection of horizontal lines. The default value is false.
- Vertical lines ID - parameter of the personal ID of the vertical lines of the indicator. The default value is RSI lines ID.
- Vertical lines show break - indicator parameter responsible for the presence of a small break between vertical lines. The default value is true.
- Vertical lines show retrace - option to restore vertical lines. The default value is false.
- Vertical lines bull color - vertical line color with height value. Default is Blue.
- Vertical lines bear color - option to select the color of the vertical line with a fall value. The default value is Red.
- Vertical lines style - type of visualization of vertical lines on the chart. The default value is Dot.
- Vertical lines width - the thickness of the vertical lines of the indicator. The default value is 0.
Indicator signals
Trading with the Bulls vs Bears JMA Lines indicator does not require much effort, since only one condition is considered during trading, which formulates the indicator under certain conditions as a signal. This is the intersection of the Bulls and Bears lines with each other. If one of the lines crosses the second and will be above it and both lines will be above or below level 0, it can be quickly determined the current trend and opened a trade at the place of their intersection. Thanks to the auxiliary vertical lines, painted in a certain color, it can be quickly identified a signal candle, and, depending on the color of the vertical line and the intersection of the horizontal ones, open a position.
Signal for Buy trades:
- The indicator lines intersect so that the line with the rise value is higher than the line with the fall value. Both lines must be above the 0 level.
- At this moment, a vertical line of color with a growth value is placed on the signal candle.
When such conditions are formed, it can be determined that the current trend is up and a long position can be opened on a candle with a vertical line. It should be closed after the appearance of a new vertical line or the reverse intersection of horizontal ones. At this moment, it can be prepared to open new positions.
Signal for Sell trades:
- The Bulls and Bears lines intersect so that the Bears line is higher, while they are both below the 0 level.
- At this point, a vertical line of color appears with the growth value.
After receiving such conditions, it can be understood that there is a downward movement in the market, and in this case, it should be opened a sell trade. It should be closed after the next vertical line appears on the chart, due to the intersection of the horizontal ones.
Conclusion
The Bulls vs Bears JMA Lines trend indicator is often used in trading, because it easily determines the current market movement and finds the best moment to open positions. Despite the simple algorithm of the indicator, it should be taken the time to study it using a demo account.