The TRIX indicator is not a relatively new tool; it was developed back in the 80s of the last century by the famous trader and analyst Jack Hutson. Like the MACD, the TRIX indicator belongs to the category of trend oscillators.
On the one hand, it is located in a separate window under the chart, and its readings are relative. On the other hand, the movement of its lines is tied to the trend.
Indicator calculations
TRIX tracks triple exponential moving average changes. This happens as follows: The resulting value will be the main parameter of TRIX. In addition, the indicator has its own moving average, which is calculated through the main parameter.
- EMA is superimposed on the chart.
- Based on the testimony of the first EMA, a second EMA is built.
- Based on the testimony of the second EMA, the third EMA is built.
- All three EMAs are assigned the same period. After the values of the last, third EMA are obtained, the main parameter TRIX is calculated: TRIX = (ЕМА 3 for the current candle - ЕМА 3 for the previous candle) / ЕМА 3 for the previous candle
Indicator settings
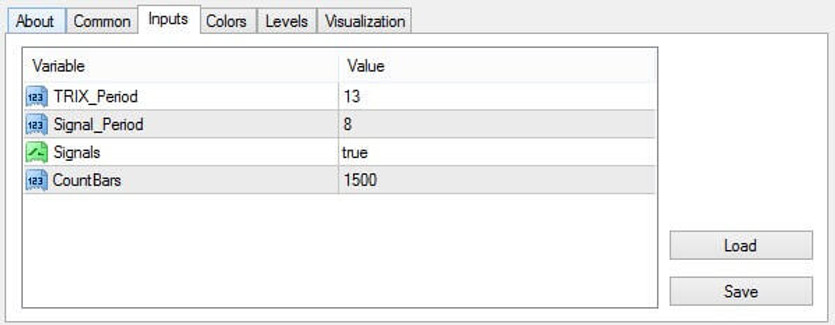
The oscillator has the following parameters, the change of which affects its readings:
- Trix Period. This is the period value that the oscillator applies in constructing the main moving average.
- Signal Period. In addition to the mainline, the indicator also has a signal. It also represents a moving average, and this parameter displays its period. In any case, it should be less than the triple EMA.
- Signals - a setting with which you can receive signals (audio or visual) about intersections of the main and signal lines. To do this, simply set it as true. If you don’t want to receive such messages, you can specify the value as false.
- Count Bars - a parameter that sets the number of candles taken into account when calculating the historical value of the TRIX indicator.

Indicator signals
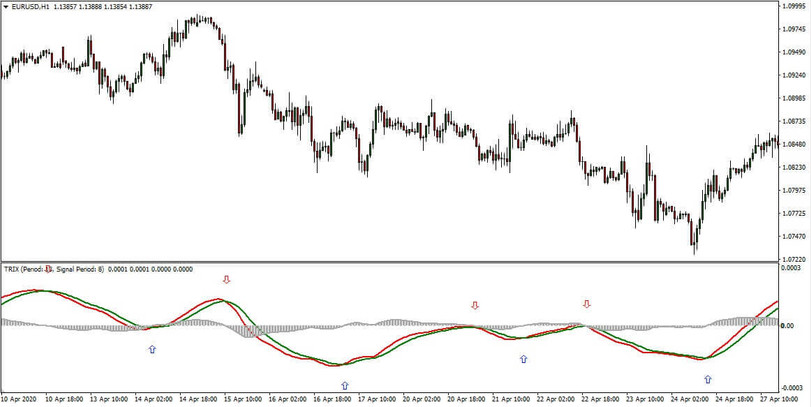
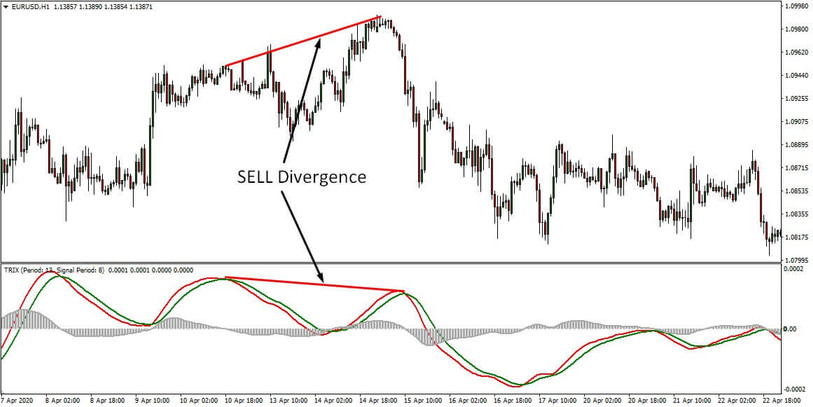
The TRIX indicator gives the trader two main signals: when crossing the zero line and when the main line crosses the signal line. In addition to the standard signals that the TRIX indicator informs of, it can also be used to determine divergence signals.
- BUY signals: the main line crosses the signal line from the bottom up, or if both lines cross the zero level in the same direction.
- SELL signals: the main line crosses the signal line from top to bottom, or both lines cross the zero level in the same direction.

Conclusion
The TRIX indicator is very popular among position traders. It perfectly filters market noise, which allows the trader to fully concentrate only on impulse sections.
As a standalone tool, the TRIX indicator is not used as often. The greatest effect from its operation is achieved when used in combination with other technical means.
In particular, a combination of channel indicators specializing in breakdowns of trend ranges, for example, Parabolic SAR or Bollinger Bands, provides good results.
Download the TRIX MT4 indicator from the button below
Tip: Can’t open the downloaded archive file (ZIP or RAR)?
Try WinRAR for Windows or The Unarchiver for Mac .
Do you need help with installing this indicator into MT4 for Windows or Mac OS? Our guide HERE will help you.


