The engulfing pattern is, in a way, the opposite inside bar. In this pattern, the outside candle absorbs the one in front of it, which indicates a radical change in market sentiment.
Typically, this setup is formed during uncertainty - the market has not yet decided where to go, as a result of which we observe temporary consolidation. The next candle just resolves the dispute by absorbing the previous one, bringing fresh liquidity to the market. The breaking of the tops of the extreme candlestick is an important signal to change the trend.
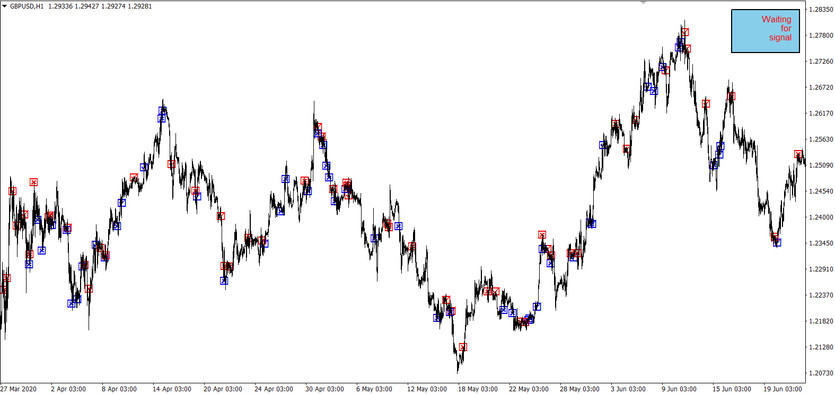
The VerticalBarSetup indicator signals the appearance of new setups and automatically calculates the entry-level, stop loss, and take profit of a trade. In addition, the indicator visualizes the success of trading on history, marking on the chart the trades closed by stop loss and take profit orders.

Indicator settings
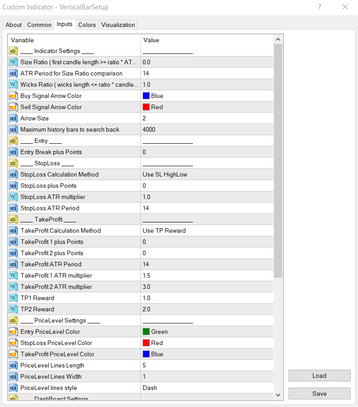
VerticalBarSetup has many parameter settings, the main ones being:
Size Ratio - filter of the size of the first candle according to the ATR reading. Here you need to specify the ATR coefficient, which will determine the minimum size of the first candlestick;
ATR Period - ATR period for calculating the candle size;
Wicks Ration is the coefficient for calculating the maximum length of shadows relative to the candlestick's total size. It accepts values from 0 to 1. A value close to zero will indicate the minimum size of the shadow.
Entry settings:
Entry Break plus Points is a filter in points for placing an order. They are required to filter false breakouts.
Stop-loss settings:
Stop-loss calculation method (in points, high/low or ATR);
Additional points for filtering false emissions;
ATR multiplier for calculating Stop-loss;
Period for calculating ATR.
Take-profit settings:
Take-profit calculation type (in points, by ATR or relative to the stop);
Additional points for TakeProfit 1;
Additional points for TakeProfit 2;
Indicator period in case of calculation by ATR values;
ATR multiplier for TakeProfit 1;
ATR multiplier for TakeProfit 2;
The relative size of the first take-profit;
The relative size of the second take-profit.

The past setups are highlighted on the chart by the indicator in the form of red and blue icons (the colors can also be changed in the settings). Simultaneously, all successful setups are displayed as a checkbox inside a square. The closed deals by the stop-loss are shown as a cross. This allows you to determine, at a glance, the profitability of a strategy in a given segment of history.
Indicator signals
The indicator signals a found setup after an additional condition is met - apart from the formation of the engulfing pattern itself, the next candlestick should close above its maximum. Thus, we enter the deal only after the breakout is confirmed.
After identifying a new setup, the indicator highlights the engulfing pattern formation zone on the chart and the trade entry-level, direction, stop loss, and profit. The indicator allows you to calculate two profit levels, but the price does not always reach the second profit.
It should be borne in mind that this model shows the result of a local struggle between bulls and bears within several candles and does not reflect a long-term picture. In this regard, no one canceled the rule of entering according to the trend, and the use of an additional trend filter, even in the form of a simple moving average, is quite a reasonable decision.
Conclusion
Objectively, this is one of the best indicators for trapping an engulfing pattern. The main distinguishing features of the indicator are visualization of the historical success of the pattern, automatic calculation of the entry-level and stop orders, as well as timely signaling when new setups appear - the engulfing and confirmation pattern.


