Knowing the price behavior of higher timeframes is essential for success with FX. It is unwise to put buy orders on lower timeframes if the higher timeframes are in a downtrend. This awareness of Multiple Timeframes is basic but often crucial and should not be forgotten or overlooked by traders.
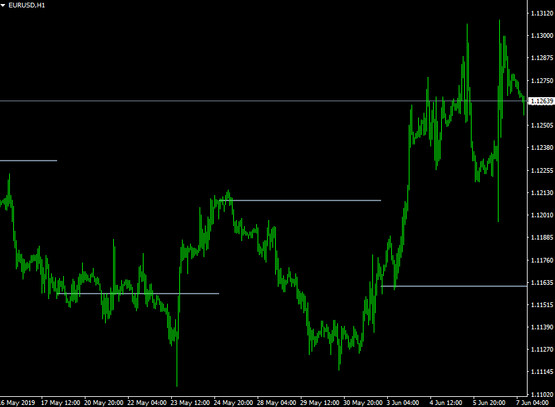
This indicator is also a useful indicator for MTF analysis. This indicator shows the opening price of the weekly on the chart. This also tells us, "How is the value going up this week?" I will look in detail about this useful indicator for MT4.
Using the indicator to display weekly open price on the 1-hour chart
You can use this indicator to show the opening price of the week on any time frame. Be aware that the opening price of the week may be a resistance zone or a support zone. This indicator is also useful for analyzing the price movements of the week.
Tips on how to use:
1. Using the opening price as a resistance zone or support zone
If the price approaches the opening price of the week, selling and buying may be mixed as the price reacts to the zone. If you have a position, it would be good to fix the profit/loss on the weekly open price. We also recommend reverse trading around this zone.
2. Analyze the price movement of the week
For example, if the current price seems to be far from the open price, it may indicate that the price/trend is overextended.
Compatibility: MT4
Parameters:
- CountDays: Determines how many open prices of weekly candle bars are displayed. If this is three, only three candle bars will be displayed
- Weekly_Open: Determines color of the line
- Line_Style
- Line_Width
Tip: Can’t open the downloaded archive file (ZIP or RAR)?
Try WinRAR for Windows or The Unarchiver for Mac .
Do you need help with installing this indicator into MT4 for Windows or Mac OS? Our guide HERE will help you.


