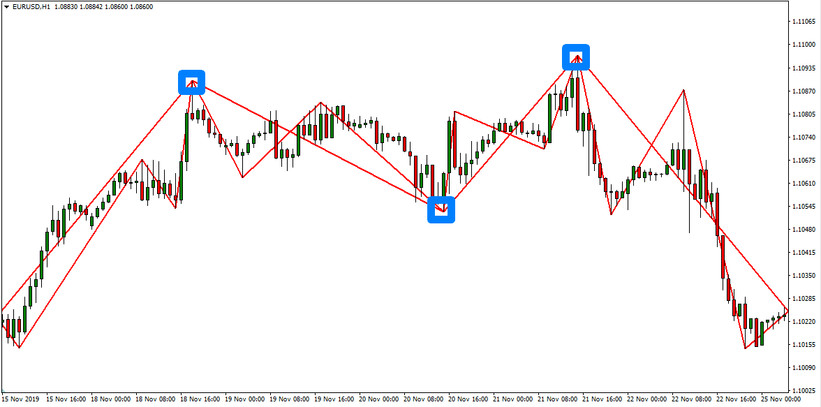
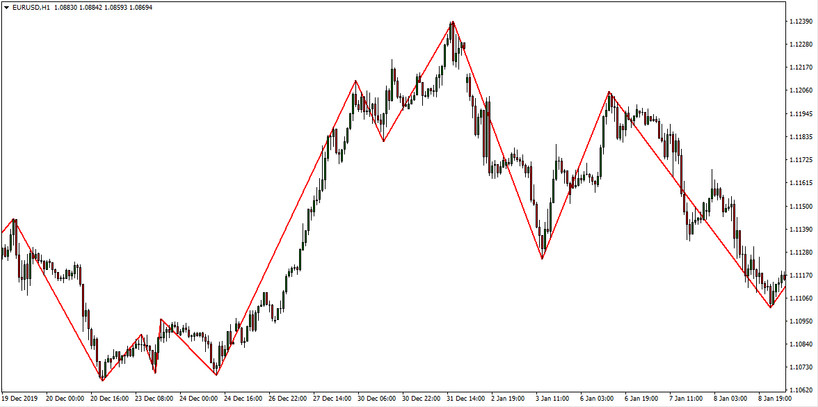
The ZigZag indicator is a technical trend indicator that combines local lows and highs and allows you to filter out price noise. Unlike most of the technical indicators used by traders, the ZigZag is not giving signals about future price behavior, but instead, it only identifies the price swings from the past.
But it is precisely on the reflection of the indicator of price behavior in the past that it is possible to predict its future behavior. ZigZag is a fairly well-known indicator that is built into most trading platforms. You can also download this indicator for Metatrader4 on our website in the Indicators section.
The ZigZag builds a line based on a minimum percentage of the price. There are three input parameters in the indicator settings: Depth, Deviation and Backstep.
Consider what these parameters are:
For example, if Depth is set to 12 (the default value of the indicator), and for Deviation to 5, then the ZigZag line only marks price movements, equal to or deviations, higher by 5%. Lower values, respectively, are ignored by it. This is very convenient, as it allows you not to be distracted by small price fluctuations and ignore price noise.
The ZigZag also often measures the initial price movements that occur in the direction of the main trend. They do not restore parts from the previous movement, but move past the previous correctional maximum or minimum.
The Zigzag makes it easier for the trader to perceive the chart. Sifting out market noises, it denotes only the most significant highs and lows. It is convenient to draw technical analysis figures and simply trend lines from the kinks of the ZigZag indicator.
ZigZag is very handy for finding the Double Peak, Triple Peak and Elliott Wave values. To more accurately find the peaks using this indicator, we recommend superimposing several ZigZag indicators at once on the price chart with different indicator input parameters. Those points at which, despite different input parameters, the indicator stubbornly draws kinks - can serve for trader as an additional confirmation of the vision of graphical analysis patterns.

Conclusion
The ZigZag indicator is the best visual embodiment and implementation of the Elliot Wave Theory. The ZigZag indicator can be especially useful for experts in this theory, and the use of the ZigZag indicator along with other technical analysis tools allows you to create very interesting trading strategies. A description of some of them that, in our opinion, deserve attention, can be found in the Strategies section.
Download the ZigZag MT4 indicator for free from the button below
Tip: Can’t open the downloaded archive file (ZIP or RAR)?
Try WinRAR for Windows or The Unarchiver for Mac .
Do you need help with installing this indicator into MT4 for Windows or Mac OS? Our guide HERE will help you.


