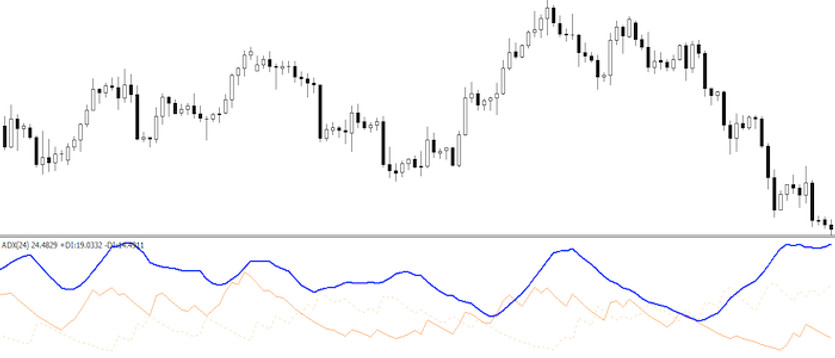
Combinations of trading indicators tend to be highly sought after among traders and are also very powerful trading tools that can achieve particularly great results.
The ADMI is one such combination that offers many uses, but its unusual nature makes it quite different from many other combinations.
Strategy entry rules
Entering long positions
- The AD line (blue on the chart below) is rising and AD and MI are relatively distant
Entry into short positions
- The AD line (blue on the chart below) is decreasing and AD with MI are relatively distant
pic
The chart above shows the indicator settings used in the preview example below. In the chart below, you can see a situation where the AD line broke (started to fall), which is considered a sell signal in today's strategy, where this situation lasted until the line swelled upwards again. You can also see on the chart the delineated area (purple ellipse) where the lines came very close to each other, even crossed, which is something to watch out for as this is what often precedes trend changes, which was eventually confirmed in this case.
With today's ADMI strategy, traders can achieve up to a 70% success rate, the ultimate value of which depends on experience, luck and, of course, trading skill.


