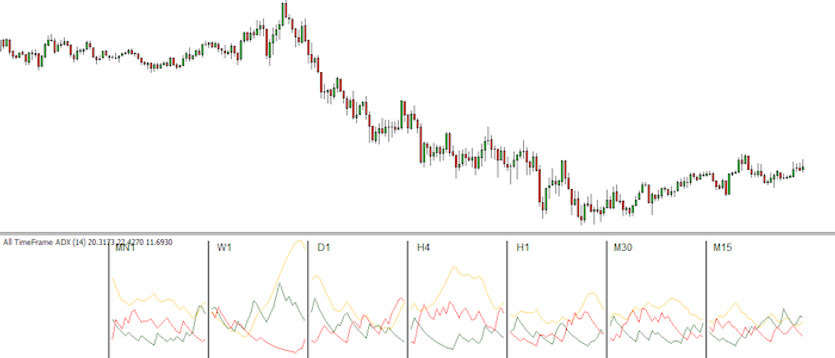
The ADX indicator is a popular trendy indicator that is based on an oscillatory nature (it oscillates in the range of 0-100), similar to the Stochastic one.
Despite the fact that the indicator primarily informs about the strength of the trend and not about its direction, there is also a trading strategy (with the help of DMI lines) with which some rising and falling trends can be traded. This strategy will now be demonstrated here.
ADX up
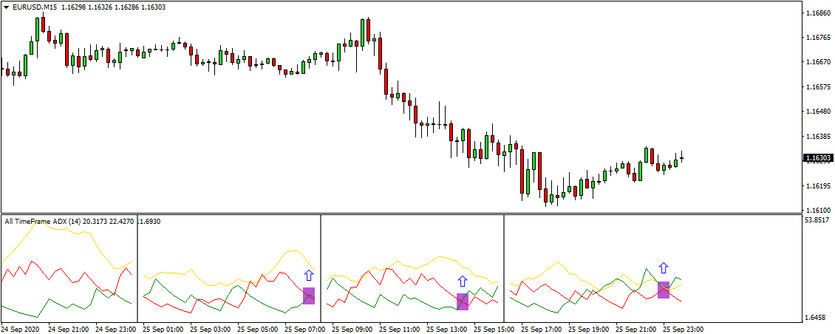
Since there are 3 curves in the indicator window, it is therefore relatively difficult to use the indicator with horizontal levels, such as the previously mentioned Stochastic. Therefore, today's strategy is not based on what values the individual curves take on at any given moment, but on their positions in relation to each other. If the curves pull together so much that they almost intersect at one point, then this usually represents a very strong buy signal for traders, based on which long entries are commonly made (see the few plotted horizontal lines on the chart below).
Warning: The ADX up is relatively very good at informing that the market will rise after this signal, but the downside is that it is very difficult to determine the size of the rise, so sometimes the market will rise by a little and sometimes by a lot more.
ADX down
The signal for the upcoming reverse development (decline) is that the ADX indicator curves are spread apart. At the same time the upper and lower curves are relatively the same distance from the middle curve (see the chart below - purple lines). However, even here we have to reckon with the problem of determining the final size of the decline.

Our strategy of today performs best on currency pairs where longer-term trends are predominantly forming and if these conditions are present in a given market, then this ADX strategy can achieve success rates of over 60%.


