AUDUSD is the first commodity currency pair that we will discuss in our series on the characteristics of price action of the different major Forex currency pairs.
Some characteristics of AUDUSD
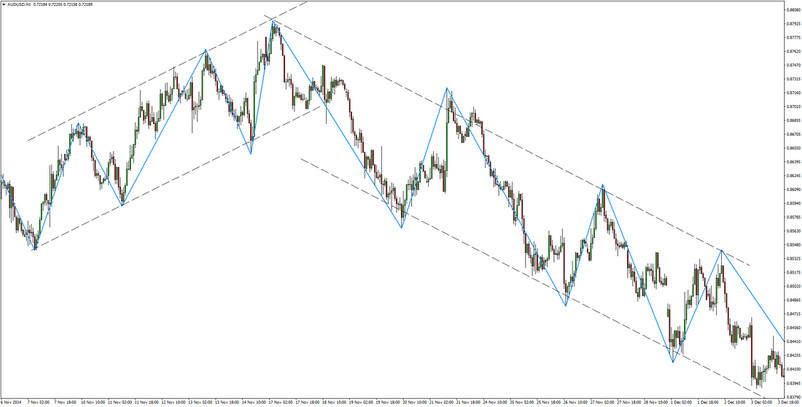
Also known simply as the “Aussie”, the AUDUSD currency pair very often trends at a very gradual pace with the price moving back and forth – often drawing a stairways alike formation on the charts. Fast and sharp one-way moves are rather uncommon and instead, the price action tends to move in a zig-zag fashion.
For example, if the trend is down AUDUSD will usually take a gradual path of making two steps down and one step up rather than just moving straight down for a prolonged period of time.
If the trend is bullish, the same tends to hold true and AUDUSD would most probably gradually move up – partially retracing many of the bullish swings along the way.
AUDUSD 1-hour chart with the Zig Zag indicator plotted (blue line) – Typical AUDUSD price action of “walking the stairs” and trading in channels. Also common, as soon as the price breaks out of one channel, another channel starts to form.
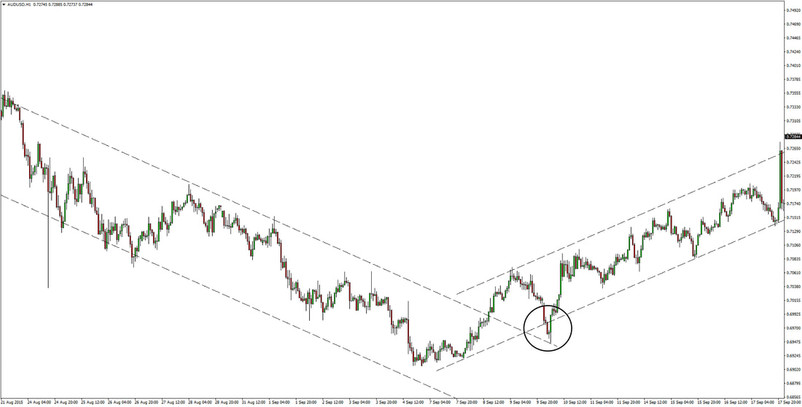
AUDUSD often trades in channel formations with breakouts generally having a good reliability regarding follow-throughs in the direction of the breakout. Reversals are rarely sharp and usually, several attempts at a resistance or support zone are needed before a trend is reversed. Retests of the broken support or resistance after a breakout are also very common – offering Forex traders great trading opportunities with excellent risk-reward.
Support and resistance zones also hold well. Bullish signals appearing at support or bearish signals at resistance offer reliable trades in most cases.
Trading conditions:
Long trade entry:
Enter on breakouts of key resistance areas with a stop below the breakout point. Bullish breakouts of falling channels also provide reliable buy signals most of the time. For this, you can also use this strategy that shows how to trade pullbacks after breakouts for getting the highest probability trades.
Trading AUDUSD requires patience on many occasions and moves may look hesitant but they sure continue to move up and up after a while. During trends, traders can use trendlines and key support levels to join in the party.
Long trade stop loss:
Place stops behind support areas, but be careful of whipsaws which can be quite common on AUDUSD. This pair tests and re-tests support and resistance zones before completing a reversal, very often pushing the price a few pips higher/lower to take out stops.
Patience in holding a trade and staying focused on the important aspects rather than on noise can be key in these kinds of situations.
Long trade exit and targets:
Target resistance zones on the chart which most often will be respected. Also, rising - resistance trendlines and the upper end of channels provide good levels to target with long trades. Taking profits at Fibonacci extensions and retracements is also a good strategy on AUDUSD.

The re-test of the broken falling channel (marked with the black circle on the chart) provided a good entry point for buy trades – AUDUSD 1-hour chart
Short trade entry:
Look to enter near resistance lines or other resistance areas after bearish patterns or bearish signals form. Bearish breakouts of support also offer good opportunities to sell.
Short trade stop loss:
Look to place stops above a resistance zone or above a breakout point in case of trading bearish breakouts.
Short trade exit and targets:
Target horizontal support zones from previous key lows.
If existing, target channel/trendline support – it’s likely that it does exist in most cases on the AUDUSD currency pair.

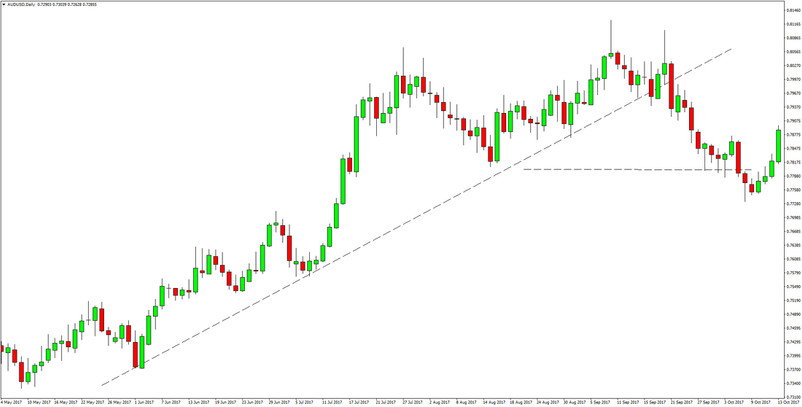
Resistance was formed around the 0.8050 – 0.8100 zone and the break below the support trendline confirmed the reversal offering a nice short opportunity to target the support at 0.7800 (dotted horizontal line on the chart) - AUDUSD Daily timeframe
A few more words on AUDUSD
- Chart patterns such as double and triple tops/bottoms, head and shoulders, harmonic patterns as well as channels and trendlines tend to work very well on the AUDUSD pair and are respected very often by the price. This is good news for chartists and pattern traders as they can rely on the information they receive from the charts and make profitable trading decisions based on it.
- Taking profits at key support and resistance levels, therefore, makes sense in most situations when trading AUDUSD as retracements during trends are quite frequent. AUDUSD rarely trends without many retracements during the trend. This can be an advantage for trend-followers as they get a lot of points where they can join in the trend and profit.
- Volatility is usually lower on this pair compared to the most volatile currency pairs such as GBPUSD, EURJPY or even EURUSD. But AUDUSD is very sensitive to economic data releases from Australia and very often huge spikes in the price can be seen during the Asia-Pacific trading session when AUD reports are published. Australian economic releases often miss expectations, either to the positive or the negative side, and in such cases, the price can frequently spike higher or lower by 50 – 100 pips or more.
- Thin liquidity during the overnight session is certainly playing a large part in the occasional large spikes in the AUDUSD price action during this time of the trading day. Either way, it’s important for traders to be aware of that and keep it in mind when trading the AUDUSD pair. Though large, these price moves caused by Australian economic reports can quite often be completely reversed after only a few hours.
- On a more long-term perspective, AUDUSD is famous for being correlated with metal prices (copper, iron ore and gold). Thus for determining longer-term trends in the Aussie and the AUDUSD pair, Forex traders should definitely keep an eye on the charts of the key metal exports from Australia.


