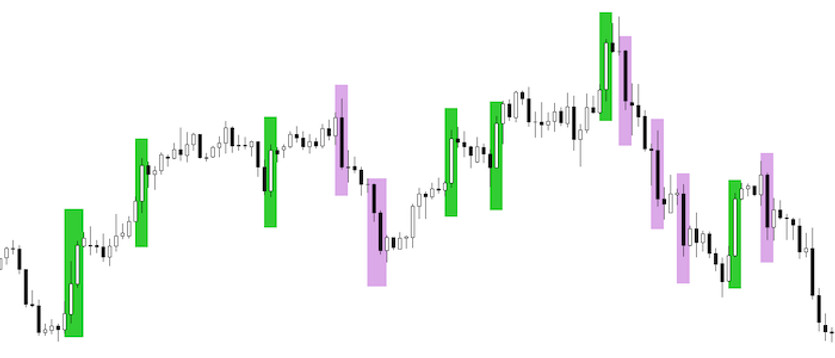
Averaging strategies are really popular among traders because it is usually another trading form that can be easily algorithmized.
Although it may not look like it at first glance, today's strategy is not at all complicated to understand. On the contrary, anyone who pays just a little bit of attention to it will understand it really soon and may even start using it in their live trading afterwards.
Strategy entry rules (example)
Entering long positions
- the market makes an above average move and an above average falling candle is formed
- Entry occurs immediately after a new candle is opened
Entry into short positions
- the market makes an above average move and an above average rising candle is formed
- entry occurs immediately after a new candle is opened
How to trade with the strategy
The most important aspect of today's strategy is determining the size of the so-called above average candle. For some this may be a candle 200 points long, while for others it may be 500, or it may also be a visual view only, but one that requires some practical experience.
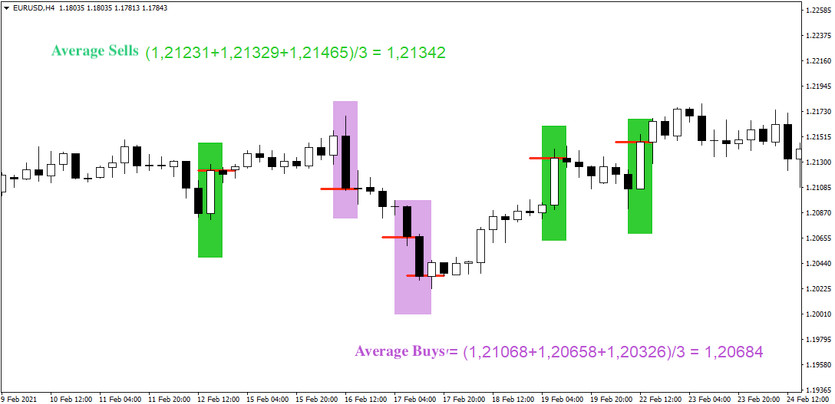
In the chart below, it is possible to see three buying positions and three sales that occurred just as the market formed an above-average candle (entries are marked by red lines). Also marked on the chart are the average values of the sells and buys, which clearly shows (the difference between the AverageSales and AverageBuys) that in the long run the averages will move away from each other and create a value-added "profit", which in this case is over 650 points (1.21342-1.20684=0.00658)

Due to the nature of the strategy, it is impossible to assess its projected success today, as over the long term the strategy will always trend towards the green numbers (ignoring overnight holding fees), but it is impossible to determine whether that will be today, tomorrow, or a year from now.


