Boolinger bands are generally very popular trading indicators not only among beginner traders but also among advanced traders, which certainly move trading forward considerably.
And it would therefore be a pity not to show, one very interesting trading strategy that not only uses the bands, but in addition to that, it comes in combination with certain S/R levels, which adds even more to the whole strategy's already unique strength.
Within today's strategy, as the name suggests, you need to have Boolinger bands embedded in the main chart (they are part of the indicator group in MT4 -> Boolinger Bands) without which this strategy cannot be implemented. The specific values of the bands are set on all of today's chart as seen in the image below.
Please note: Bands with default values can not be applied on every currency pair and timeframe.
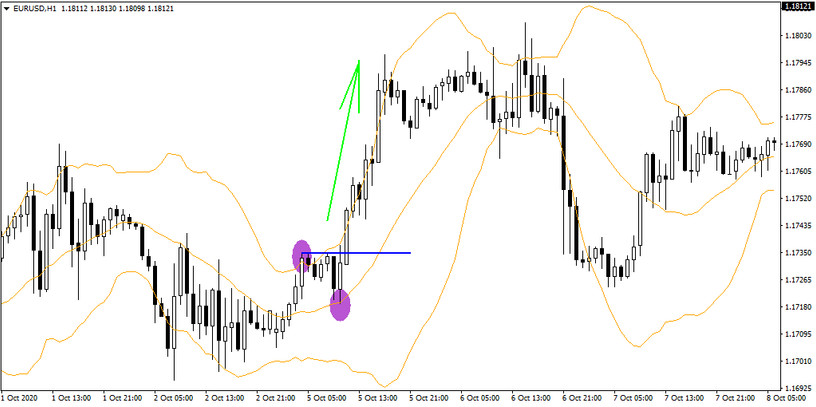
Today's strategy is relatively very simple. First, we need to wait for the upper/lower Bollinger band to be hit, and once a given candle completes, its wick determines the so-called S/R entry boundary (see blue line below). After this first hit, there is still a need for the center line to be hit in the case of Boolinger bands (see the second purple ellipse on the chart below). It is only when price subsequently reaches the S/R level that the entry in the direction of the hit is made.

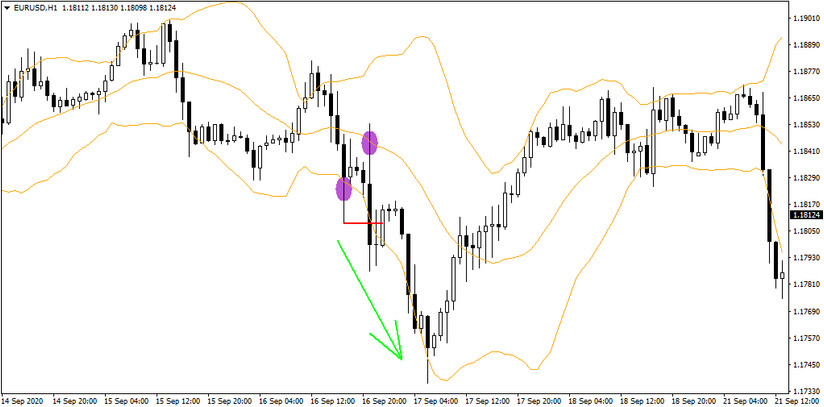
The next graph below shows the opposite situation to the one shown in the graph above. Again, after both hits occurred and the price subsequently reached the S/R level, the entry into the sale was realized.

With the Breakout strategy on Boolinger bands it is possible to achieve success rates in the range of 65-75%. The final amount is influenced not only by the instrument on which the strategy is implemented, but also by the trading cycles and, of course, the experience of the trader himself.


