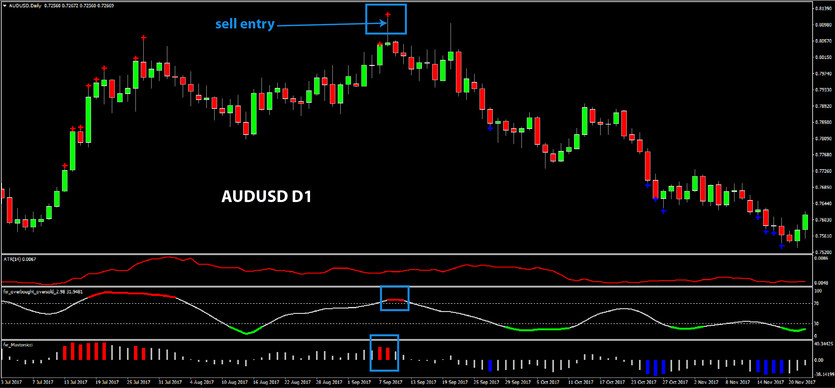
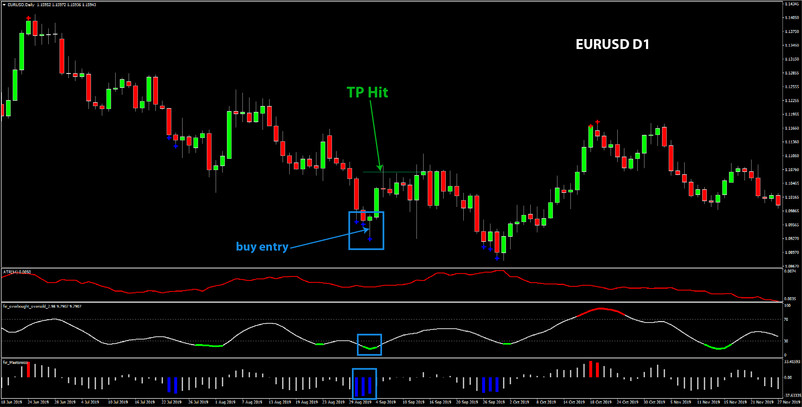
The Hammer Candle Strategy is a ridiculously simple system but is very effective when the signals occur. As is often the case, simplicity tends to beat complexity when it comes to trading systems, and so that is the case here too.
This strategy has a high success rate (of hitting the targets), but signals don’t occur particularly often. That’s because it is to be used only on the daily timeframe and perhaps higher ones. When the signals occur on higher timeframes such as the weekly or monthly, they should be minded as the implications are quite important for the technical picture where they occur.
Although the strategy works well on the weekly and monthly timeframes, too, for best trading results, use the daily timeframe. On shorter-term timeframes such as the 4H, 1H or lower, the effectiveness of this method is much weaker, so it is not best-suited for day-trading (though it could definitely be useful).
Indicators used:
- The advanced FxTR Divergence indicator (download it for free here)
- The advanced FxTR O/O indicator (Overbought/Oversold) - download it for free here
- Average True Range (ATR) for determining TP targets
Strategy Rules:
Put simply, we are looking for a hammer (bullish) or shooting start (bearish) candle to occur at a time when the advanced O/O and Divergence indicators simultaneously give a reversal signal. So, all three signals need to be present for the entry to be triggered.
The hammer and candlestick patterns are great because they are very early indicators for picking tops and bottoms. Any crossover signals like a MACD or other indicator will be much later in giving you a signal.
But used alone, the candles are not nearly as effective as when used together with other indicators as part of a robust strategy. That’s why here we are using our advanced Divergence and overbought/oversold indicators, which filter out the low-quality signals and point us to the high-quality ones. Then, when the hammer or shooting star candle occurs, we get the final confirmation that this is a trade worth taking.
Below are the specific entry, stop, and TP target rules for buy and sell orders.
Buy Entries:
- Stop below the hammer’s low
- 1st target: 1 X ATR Value
- 2nd target: 2 X ATR Value
- We use the ATR indicator for a volatility-based profit target. So, the minimum target is the average daily range for that currency pair as determined by the standard ATR settings. For the 2nd target, use a distance that is double the daily range of that pair.
Sell Entries:
1. FxTR O/O indicator is in the oversold area (the indicator turns red when this happens)
2. FxTR Divergence indicator shows there is bullish divergence present (the indicator gives a red cross signal on the chart when this happens)
3. A bearish shooting star candle occurs at this time. It is OK if the shooting star candle occurs 1 or 2 candles after the other two indicators gave the sell signal but not more than that.
- Stop above the high of the shooting star pattern
- 1st target: 1 X ATR Value
- 2nd target: 2 X ATR Value


