A trading strategy called Two Fingers is ideal for those traders who are limited in time and cannot constantly be at the computer. The system is daily, the price analysis is carried out on the D1 charts, but the entry points are looked for on the H4 time frame. The strategy is trending, but trades are carried out on corrections of the trend movement. This system is implemented using three indicators: MA, OsMA, and Fractals. You can find these indicators on our website in the Indicators section.
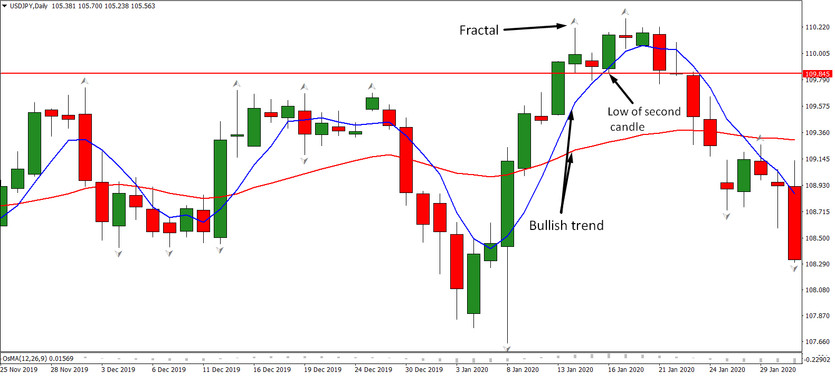
Market analysis, according to the Two Fingers strategy, is carried out on the D1 chart. It is necessary to determine the trend's presence and direction, and this is done using moving averages that must first be applied to this timeframe. Two moving averages are used for analysis: one with a period of 22 (red), the second with a period of 5 (blue). If the moving red line is above the second, blue one, then we can talk about a downward movement, if on the contrary - then an upward movement.
After determining the trend and its direction on D1, it is necessary to wait for a fractal's appearance opposite the trend. (The Fractals indicator must also be pre-installed.)
When the second candlestick after the appearance of the fractal closes (that is, on the second day after the day on which the fractal appeared), you need to draw a horizontal line:
by candle high, if the trend is downtrend;
by candle low, if it is up.

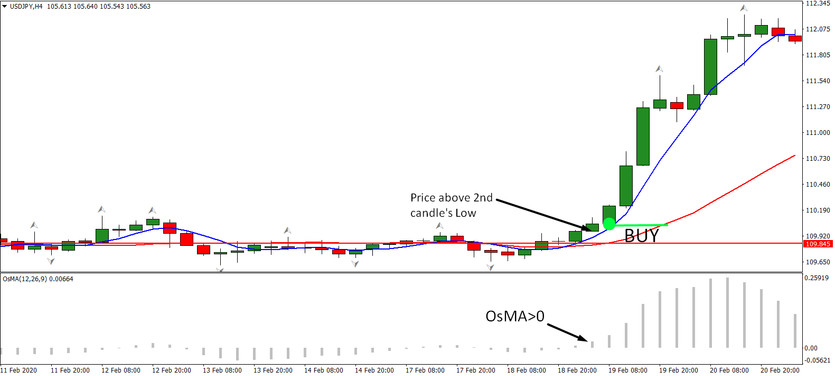
Next, you should switch the chart of the studied currency pair to the H4 timeframe and apply the OsMA indicator to it with the default parameter values. After waiting for OsMA to consolidate above (for buy deals) or below the zero-level (for Sell deals), you can open a position. This signal should appear above the previously drawn red line.

Thus, the conditions for opening positions for this strategy look like this:
On the daily chart, MA (5) is above or below MA (22) - based on this signal, the Two Fingers strategy identifies a global trend (in this example, it is an upward trend);
An upper fractal has formed on D1 (or a lower fractal in a downtrend), i.e., a local vertex should appear;
When the fractal is formed, a horizontal line is drawn through the Low (or High, if the trend is downtrend) of its last candle (the second from the center of the figure);
Next, you should switch the timeframe to H4 and wait for OsMA to consolidate above (below - for sell deals) the zero level. This pattern should appear above the red line built earlier on D1 (or below it - for Sell deals).
Stoploss and TakeProfit
Concerning setting stop-loss and take-profit, there are several options. The most successful option is to set SL for a local extremum on the chart with the H4 time frame, or for the maximum (minimum) of the fifth candlestick on the daily chart. For traders who trade in the long term, it is better to set a stop loss based on the daily chart. But at the same time, do not forget about the negative swap and the loss it brings.
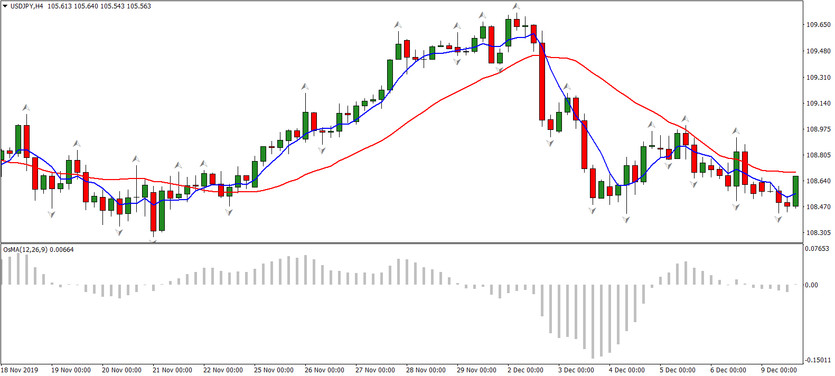
The trade is closed when the OsMA indicator histogram crosses the zero level in the opposite direction. It is allowed to transfer the transaction to breakeven with pulling up the stop-loss when a certain amount of profit is reached and complete closing when the moving averages cross the other way on the daily chart.
Conclusion
Considering that this system is not demanding when making deals, it is ideal for those traders who cannot constantly be at the computer. Also, the use of money management rules in the Two Fingers strategy, in which the risk for one transaction should not exceed 1% of the deposit's size, will improve trading performance.


