Flag patterns and their cousin, the pennant pattern are powerful tools that can give you a statistical advantage when it comes to trading in any market. Being able to identify them and trade them effectively can have a significant effect on your trading success.
Flag and Pennant Patterns
Flag and pennant patterns are chart patterns that signal the continuation of the prevailing trend. Flag patterns are drawn with a trendline to connect the highs and a trendline to connect the lows. If the lines are more or less parallel, this is a flag pattern. It is called this because it is rectangular, even though slanted upward or downward, and resembles a flag blowing in the wind. A similar pattern where the highs are becoming lower and the lows are becoming higher is a pennant pattern. It is called this because it resembles a pennant, which is a triangular flag.
Buying a Gap-Up After a Flag Pattern
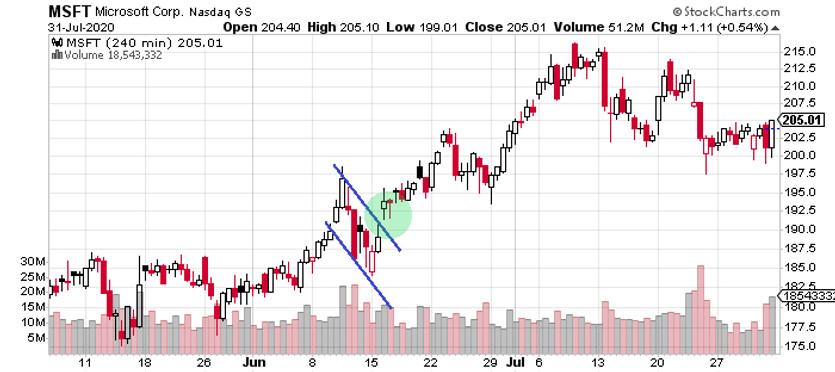
This strategy works best in the middle of a trend. As you can see on this 4-hour chart of Microsoft Corp. (NASDAQ:MSFT), the price began rising in late May and picking up in early June. Then the price began to slope downward. This is a classic flag pattern and suggests that the trend is just taking a breather before resuming.
Whenever a gap occurs in a market, it is the result of significant pressure before the market opens. With stocks, this could be pre-market trading. With Forex, although the retail markets are closed on the weekends, significant trading could take place among central banks and elements of the InterBank system that make up the Forex market. So, whenever you see a gap in the market, it should be respected as a strong move.
In this case, the price move broke the resistance level defined by the upper trendline of our flag pattern. We would enter a buy order on that gap candle. As you can see from the subsequent moves of the price after that point, it would have been a great decision.
You can place your stop loss at a point just below the upper trendline at the time you enter the trade. There is no simple way of determining a take profit point. In this case, selling at any point during the sideways market that developed beyond the first week of July would net you a handsome profit.
Conclusion
Continuation patterns are nice for trading because it gives you an opportunity to buy into an ongoing trend at a great price. Some traders interpret them as the end of the trend and they begin to unload their positions, contributing to the depth of the flag pattern’s pullback. However, the deeper the pullback, the bigger the “sale” on the stock when the gap-up occurs. And if there was significant short-selling based on the premise that the trend was ending, the rush by these sellers to exit their positions will drive the price up even more.


