Although more than 70% time the market is in a flat state, most Forex trading strategies are trendy. Thus, by ignoring the sideways price movement, traders use less than 30% of the trading potential of currency pairs. The Rubber Band strategy is designed to close this gap since it is a flat system.
The success of trading in a flat depends on the accuracy of the trade entry and the timely closing of the position. It is optimal to enter the market when rebounding from the border of the side channel and to exit the trade approximately in the middle of the price fluctuation range. There is always a possibility that the flat will turn into a trend movement, so it is very important to have time to fix the profit, albeit not the maximum possible one.
This system uses the following indicators:
Moving Average Indicators;
Bollinger Bands indicator;
RSI indicator;
Round Levels indicator.
Together, these tools are designed not only to determine the moment of a rebound from the sideways border, but even make it possible to find points of flat stretching - when the price goes beyond its limits, and then returns and crosses the entire corridor in the opposite direction. This allows you to enter the market even outside the flat, and additional signals confirm the signal quality and filter out false ones.
There are two main ways to define a flat for this strategy:
1. Building a horizontal channel. This method assumes that the trader is experienced enough to by eye determine the sideways trend. To do this, you need to identify two or more price highs located on the same horizontal line, and at least two price lows, which also have the same price. The horizontal line tool can help a trader in this - you just need to put it on the chart and move it manually until the extremums are caught.
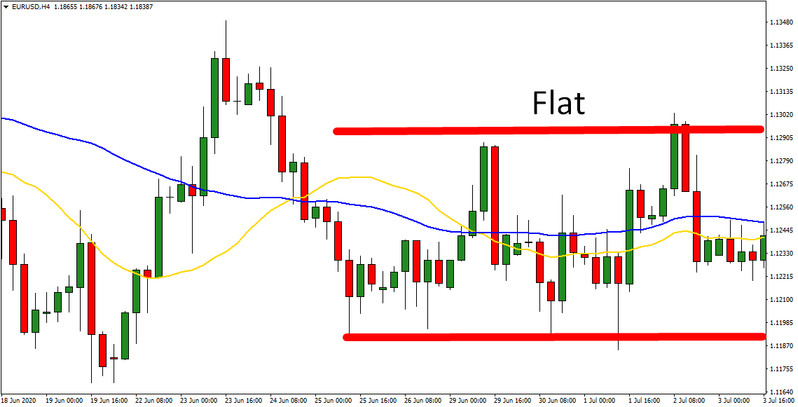
2. Using moving averages. This method is easier since you just need to follow the indicator signals. The message that the market is in a flat will be the interweaving of the moving average with each other or their parallel movement. It is recommended to set the periods for two MAs 20 and 50.
It is best to use both methods simultaneously - if a clear horizontal channel is visually traced on the chart, and the moving averages are intertwined, this will be a strong signal. The flat is determined on the H4 timeframe.
Before starting trading, you should also make sure that important economic news is not planned for the near future - the latter can provoke a trend in the market, and we will no longer have conditions for a transaction.
To work on the strategy for each traded currency pair, you need to open three windows with H4, H1, and M15 timeframes. The following set of tools is installed in each of the windows:
Window H4. Two Moving Average indicators should be installed here. Periods - 20 and 50. For convenience, select different colors for MA;
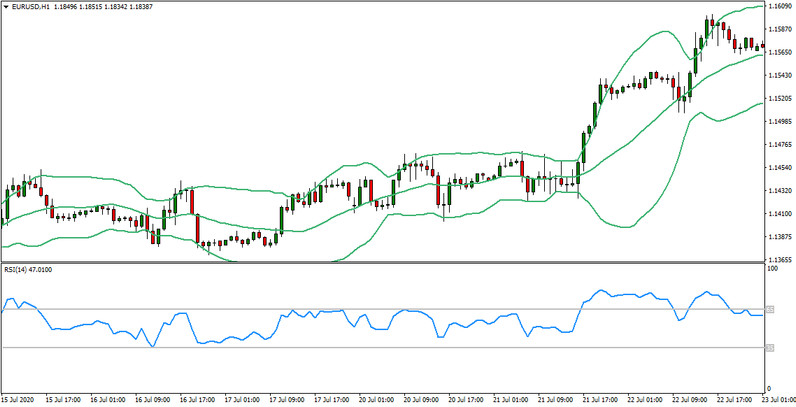
Window H1. In this window, set the Bollinger Bands with standard settings and the RSI indicator. For the oscillator, leave the default period, and change the overbought and oversold levels to 35 and 65;
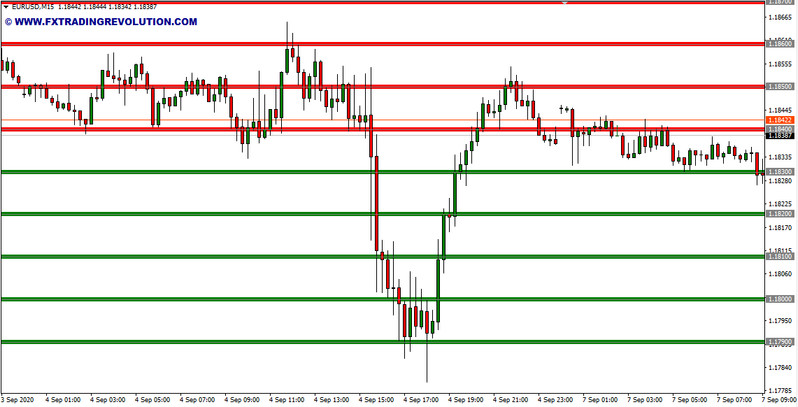
In the third M15 window, set the indicator of round levels.
Conditions for opening long positions
To opening a long position, the following conditions must be met:
1. On the H4 timeframe, a flat segment is fixed. The chart fluctuates in a horizontal range, the moving averages are intertwined, or move horizontally, and the distance between them is minimal;
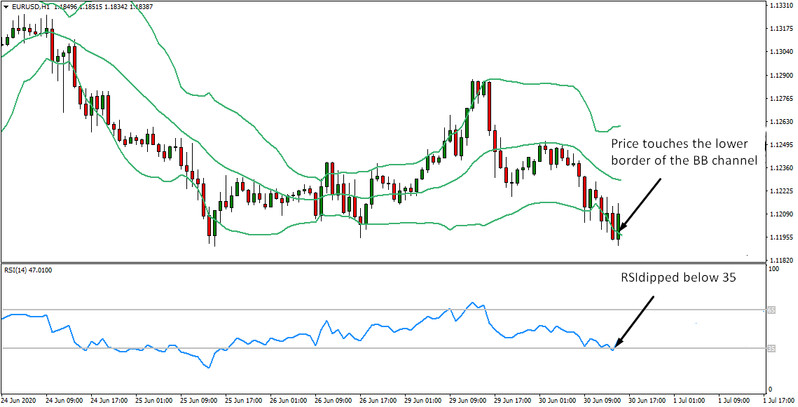
2. On the H1 timeframe, the price broke through the lower Bollinger line, and the RSI entered the oversold zone below 35;
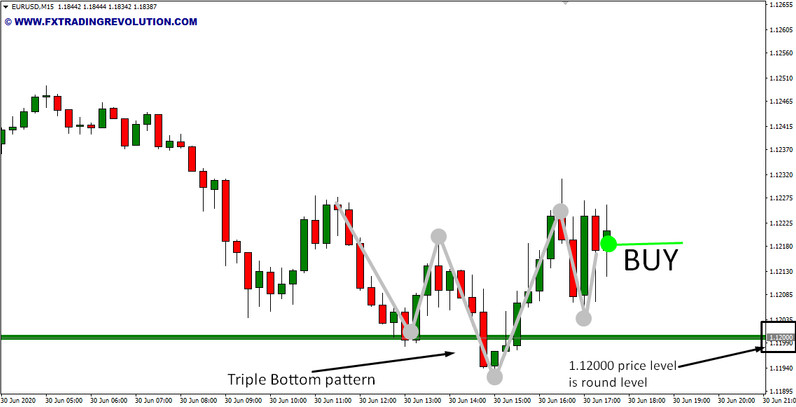
3. On М15, a signal for a trend reversal is required. It should be a pin bar candlestick pattern or a chart pattern like a double or triple bottom. In addition, the price should bounce up from the round price level. Only if all the above conditions are met, a deal is opened.
Conditions for opening short positions
Short positions are opened in a mirror situation:
1. On H4 flat;
2. On Н1, the price broke through the border of the Bollinger indicator from the bottom up, and the RSI rose above 65;
3. A reversal pattern has formed on the M15, and the price bounces down from the round price level.
Stoploss and TakeProfit
Stop-loss is set a few points below (for buying) or above (for selling) the extreme of the signal candlestick, or an adjacent one if its maximum/minimum is higher/lower. Take-profit is set at the level of the middle line of the Bollinger Bands - approximately in the middle of the channel. And then it doesn't move as the Bollinger Bands move.
Additional recommendations
1. When looking for signals to enter a trade, it is necessary to track the previous price extremes. If the signal candle breaks the previous minimum or maximum, a trend may start, and it is better to refrain from opening a position.
2. Before entering a trade, it is better to wait for the price to break through the round price level and then reverse in the opposite direction. Signals for a rebound from the level without breaking it are also acceptable, but not so reliable, because a retest of the key mark is possible.
Conclusion
Rubber Band is an interesting strategy that combines, on the one hand, the simplicity of the tools used, and on the other, several levels of filtering and signal confirmation. As a result, we get a TS that even a beginner can figure out, and the strategy itself gives quite reliable signals.


