Every currency pair in Fx has a unique character. GBP is famously known among Forex traders as the most volatile major currency, and normally, most of the GBP Fx pairs are highly volatile, including the most popular one - GBPUSD. As a result, different trading strategies have been created purely based on this volatility of the Pound, a notable example being the London open breakout strategy .
A little bit about GBPUSD
GBPUSD usually exhibits very trending price action that is very specific to this pair only. When a trend starts on “Cable”, the price can travel great distances without much looking back or pausing. Trends are also often thrusting with tall candles followed by tight consolidation. Sometimes retracements are also volatile, with tall candles in the opposite direction of the trend. But, nonetheless GBPUSD trends don’t stop easily, and such retracements don’t last very long before the predominant trend continues and catches momentum traders on the wrong side of the market.
All of the above suggests that we should probably be using a different set of indicators in a slightly different way when trading different currency pairs. For example, chart patterns are often disrupted on GBPUSD due to the volatility. The structures are often in an irregular shape and it is not uncommon for GBPUSD chart patterns to fail miserably.
So trading reversals such as trying to pick top and bottoms can be very tricky and is not the best way to trade this pair. Using trending strategies on GBPUSD, however, tends to work much better. In this article, we’ll focus on this aspect of trading the GBPUSD currency pair.
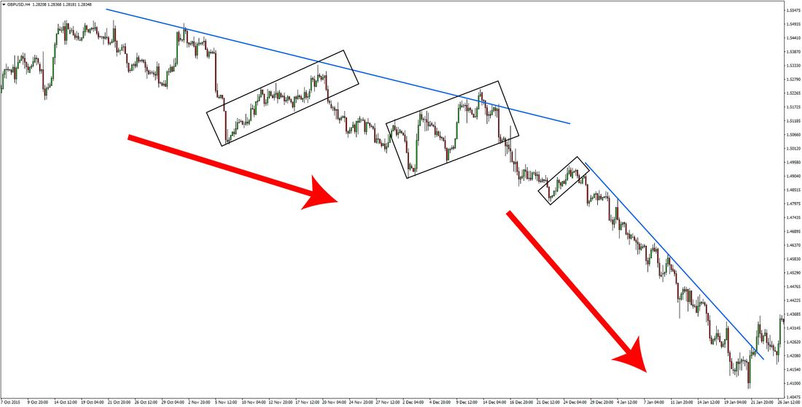
GBPUSD 4-hour chart - Once started, trends can often accelerate instead of reversing on the GBPUSD pair
Trading conditions:
Long trade entry: Long trade stop loss: Long trade exit and targets:
- Look for a trend to exist first. Best to confirm this on higher timeframes and then switch to a lower timeframe to look for entry signals. You can check out some of the trend-trading strategies found under the strategies section here which can also be applied on GBPUSD.
- Look to buy the dips on retracements when bullish signals appear such as the price bouncing at support or a continuation chart pattern appearing.

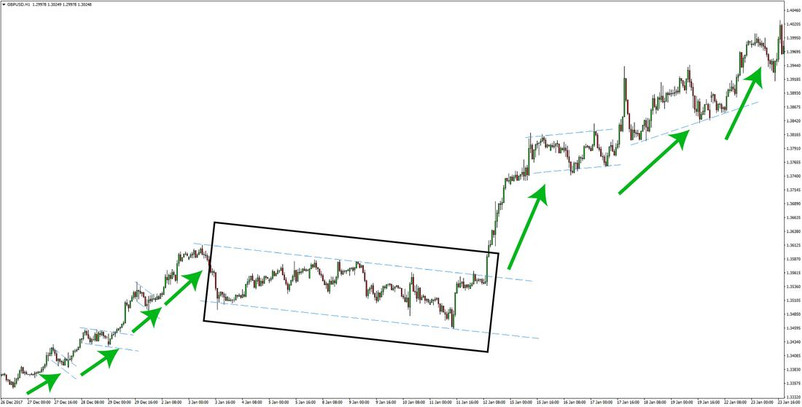
GBPUSD 1-hour chart - Small retracements and bullish continuation are common when GBPUSD uptrends develop. The black rectangle in the middle indicates a retracement of a larger degree also visible on higher timeframes.
Short trade entry:
- Find a solid trend on the higher timeframes
- Look for continuation patterns/signals to sell the rallies
- Enter at solid resistance levels or bearish (continuation) patterns
Short trade stop loss:
- Place stop loss behind a resistance area.
- Falling trendlines, moving averages and Fibonacci retracements can also be used to place a stop loss.
Short trade exit and targets:
- Exit trade if the price crosses above a falling trendline or another indicator that was clearly acting as resistance during the trend

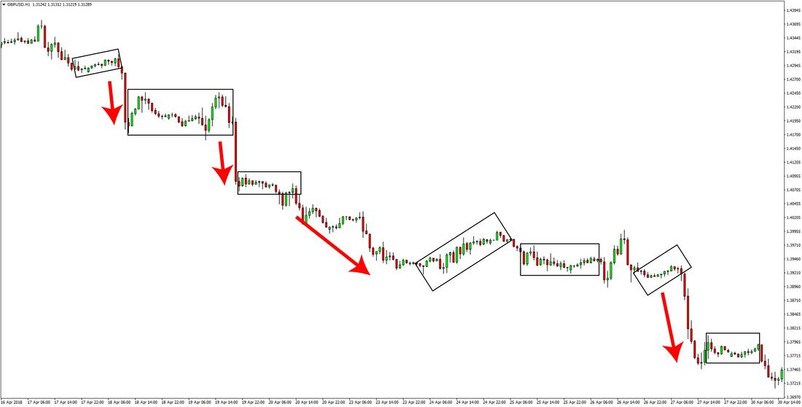
Cable follows the same script to the downside as well. Large candles take the price lower followed by tight (small) consolidation - GBPUSD 1-hour chart
Some additional guidelines:
Pound sterling is generally an unstable currency for trading due to its volatility. Sharp intra-day reversals happen often. For example, GBPUSD can surge in the morning and then give up all those gains. In the afternoon, it can fall further and at the end of the trading day, close in the red.
Sometimes booking profits early is a smart tactic on GBP pairs for these reasons. Price swings of 100 pips in both directions on the same day is something that can be regularly found on the charts of GBPUSD. This is especially true on big days when the economic calendar is packed with important events.
Horizontal ranges with tall candles and fast-paced price action in both directions can also be seen on this pair. Breakouts can be difficult to trade in such situations as the support and resistance lines of the ranges are rarely clear-cut.

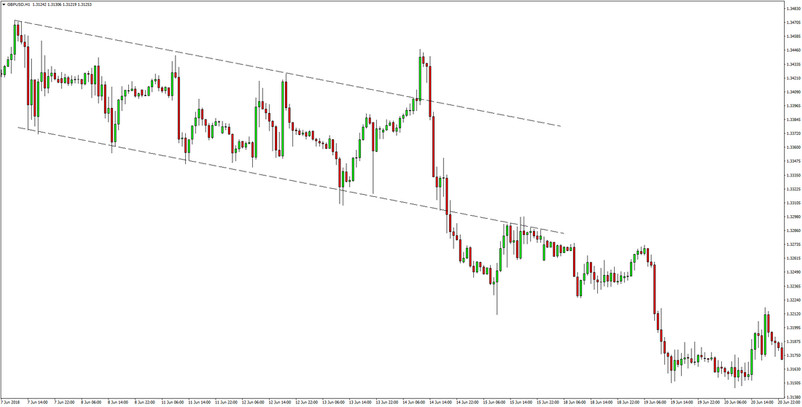
GBPUSD doing its thing - 1-hour chart
On the above chart, notice how the candles inside of the channel are all tall – both green and red. Usually a tall candle is an indication of strong momentum, but unfortunately, on GBPUSD, that signal has proved to be rather ineffective and often misleading. In the middle of the chart, we can see a fake breakout, also a situation that is quite common on GBPUSD.
Generally, all GBP pairs are trending. It’s commonly known that GBPJPY and GBPNZD are one of the most volatile and most trending currency pairs in Fx. Instead of range-trading or top/bottom picking, look to trade powerful trends on GBPUSD such as the ones shown in the first 3 charts. Look for a tall bar followed by small candles (consolidation) and then another tall bar in the direction of the previous one. In such cases, trends on GBPUSD normally last for longer compared to other currency pairs.


