Trendlines are a powerful tool for tracking the position of price when it is undergoing a trend. When this trendline gets broken, it is a sign that the price is slipping out of the identified pattern. Most of the time, when an established trend is strong enough, the price will come back in line with the trend.
Drawing Trendlines
Drawing trendlines is simply a matter of connecting the lows or highs together. Not every high or low will fit on a trendline perfectly.
As long as the extreme lows or highs are captured, without forcing a trendline on a market where it simply does not belong, the trendline will be statistically significant.
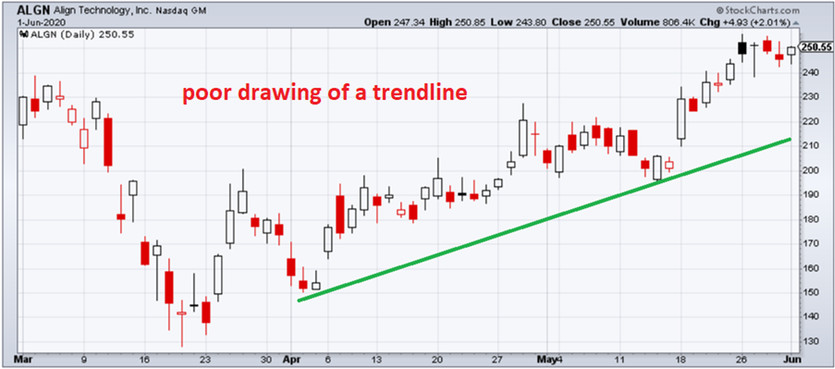
Look at this poor example of drawing a trendline on an actual market.
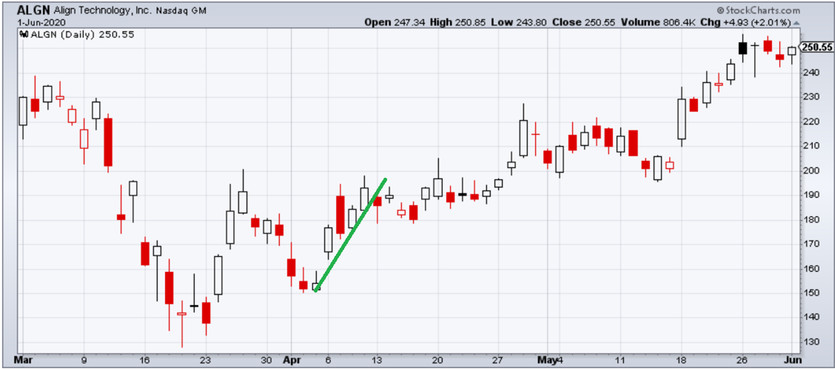
The trendline only really describes two points in the price action. It skips way too many lows in the market. This market is too choppy and sideways to be good for a trendline. If we try to draw a trendline at the start of that trend that fits the price action, we will find that it breaks the trendline and never returns back above it.

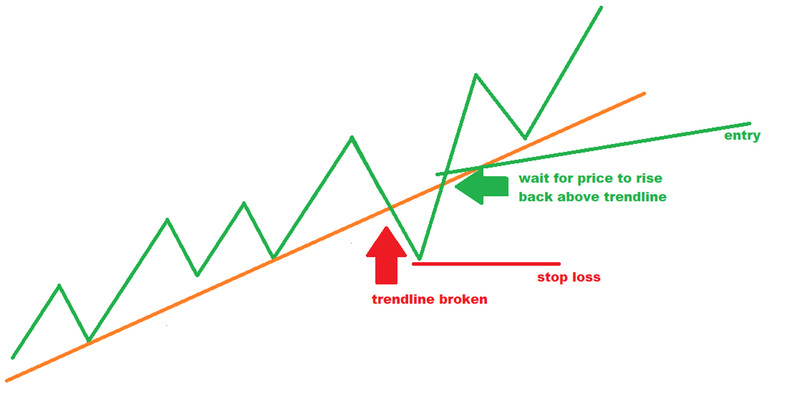
Look at the following illustration for how to draw a trendline. When drawing the trendline for an uptrend, you want most of the lows to be hit. You don’t have to hit all of them, but the more you miss with your trendline, the less significant the trendline is.

Trading Trendlines
When you have identified a trend that can be bound reasonably by a trendline, the first step is to wait for the price to break through the trendline. Once this break of the trendline has occurred, you will wait for the price to return above the trendline. This is your entry point. You will set your stop loss at the extreme low that the price reached when it broke the trendline.
When you find a nice trendline and properly execute a trade like this, it can feel like you’re cheating. After the trend leaves the area of your entry, the price zig-zags along, sometimes touching or coming close to touching the trendline, but even when it breaks the trendline it is nowhere near your entry point.
With strong trends well-defined by a trendline, it is best to let it run for a while. If your trading style limits the time you like to keep your trades open, you can use the size of the swings of the trade to estimate an appropriate take profit.
For example, if the stock is going up 0.50 to 0.75 per day on the upswings and going down 0.25 to 0.50 on the downswings, you may estimate a take profit of 0.25 for every day you'd like to keep the trade open. If you are a day trader, you can adjust this for hours or even minutes. Another way to deal with the exit is to wait until a trend termination signal is received, whether from a candle pattern or a breach of the upper band of volatility channels like Bollinger Bands.


