This classic strategy is a strategy based on values of the Ichimoku indicator known in the community of traders and involves an understanding of the principles of constructing indicator values. You can download this indicator and find its detailed description, its values and formulas for its lines construction on our website in the Indicators section.
In this strategy, the main indicator values for finding buy and sell to the deal are the location of the Tenkan, Kijun and Chikou Span lines, and the search for their intersections.
Search for a buy signal - Golden cross
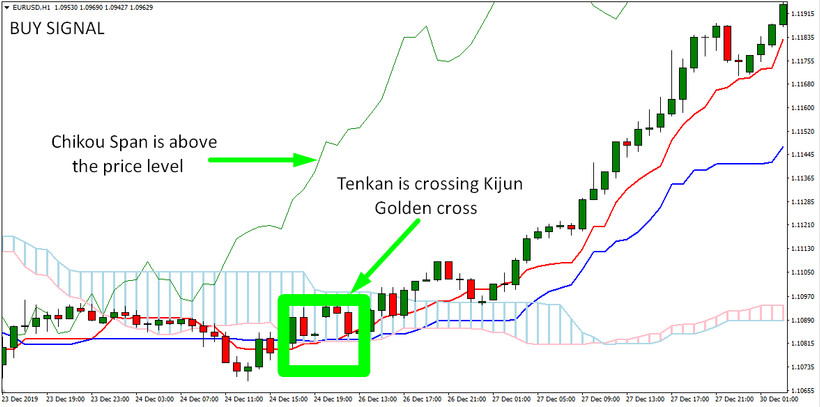
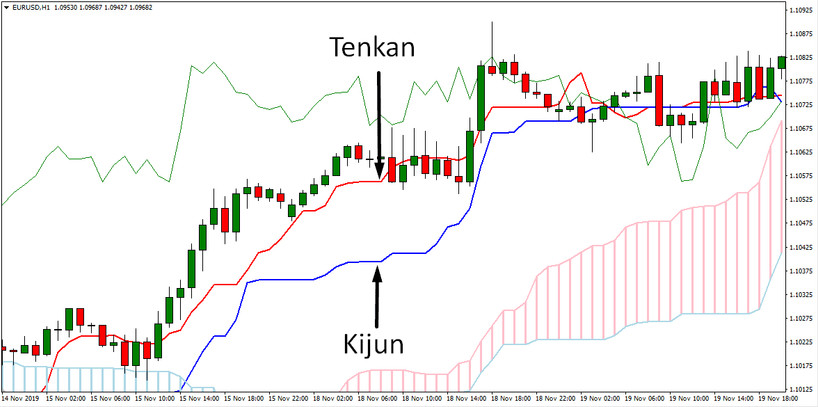
The golden cross in this strategy is the moment in time when the red Tenkan line crossed the blue Kijun line from the bottom to up, forming a figure similar to a cross. This is the first sign for the opportunity to make a buy trade. After the explicit detection of such a signal, proceed to explore the position of the Chikou Span line (green) regarding the price of the chart.
Depending on how it is positioned relative to the price, the reliability of the signal may increase or decrease. If the Chikou Span line is above the price level during the formed Golden Cross, this is a stronger and more reliable signal for making a buy deal than if the line is below or in the middle of the price level.

Search for a sell signal - Death cross
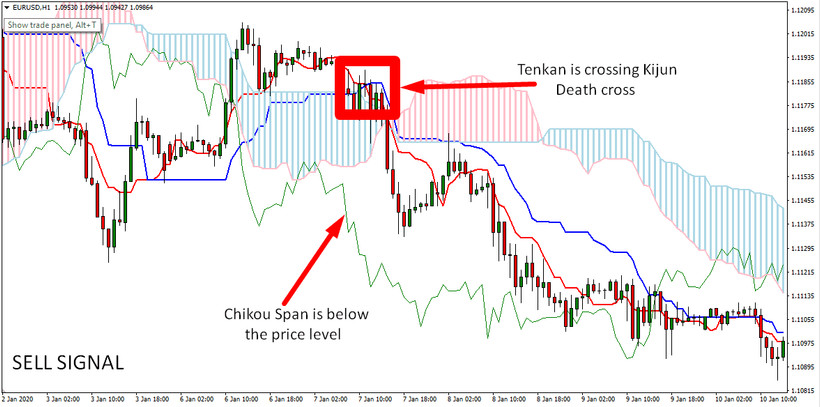
Similar to the search for a buy signal, you should look for a sale opportunity with opposite values. The Tenkan line crossing the Kijun line from top to bottom is called the Death Cross and serves as a signal to enter a deal to sell.
Moreover, if the Chinkou Span line is below the price chart at the position where Tenkan and Kijun lines ae crossing, the sell signal strengthens and becomes more reliable.

Pay attention, that with a buy signal, the Tenkan line crosses the Kijun line from bottom to top, and with a sell signal, it crosses up. The confirmatory location of Chinkou Span also changes location depending on the purchase or sale.
Take Profit and Stop Loss
The strategy implies that the Death Cross signal is the closing point of the buy deal, and the Golden Cross signal is the closing point of the sell deal. This means that the stop loss and take profit of buy or sell are set after the formation of the opposite signal.
However, predefined take profit and stop loss may be set depending on your risk control system. When setting take profit and stop loss, also take into account the timeframe on which you use the indicator Ichimoku. The shorter the timeframe you have chosen, the shorter the take profit and stop loss are set from the entry point to the trade.
Conclusion
The Tenkan and Kijun line crossing strategy is universal and can be successfully applied to most trading instruments. Experiment with the timeframes of the actives on which you apply this trading strategy, since for each trading instrument, a certain successfully chosen timeframe can help to obtain a more positive trading result.


