Moving averages are nowadays a standard on every trading platform, but only a few people can actually use them correctly.
Our improved Moving Averages System not only eliminates a large number of false signals, but at the same time increases the chance of success several times over, and it is possible to trade even the longest trends the markets have to offer.
Probably everyone who has ever traded a bit knows that in the case of moving averages, the most used methods in trading are either crossing a moving average with another moving average, or crossing the average and the price. And so we are going to present here today how to simply improve both methods so that they can be used to trade the most extreme market situations and also provide a high chance of success.
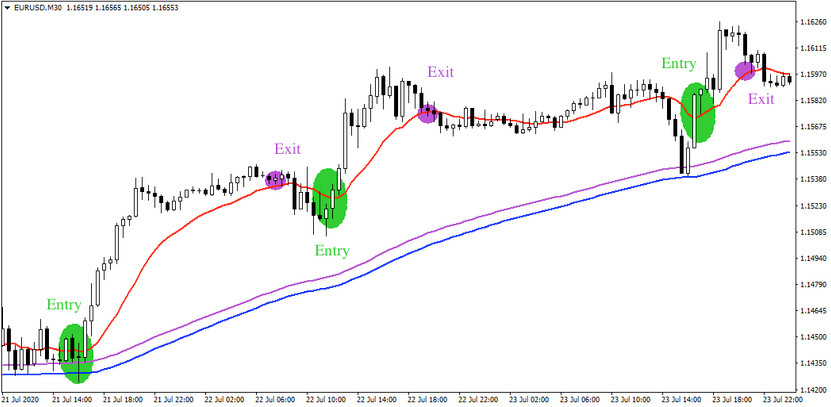
As a first one we picked the crossing of the moving average with the price. Normally, this method provides many signals, from which one can only pick out the really interesting ones with difficulty. However, our improved method of crossing the average with the price uses two slow averages in addition to the fast one (the red line). If the slow ones are below the current price, it tell us that it is now profitable to make only long entries and, conversely, if they are above, it is more profitable to enter short positions. The other condition is that entries only occur when an already closed candle has opened on one side of the fast average and closed on the other, and at the same time to do this it should be candles that have a relatively longer body and have not closed near the moving average (see chart below).

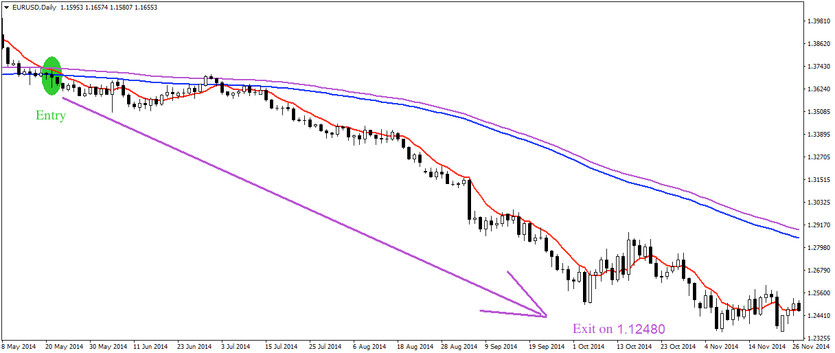
The second improved option is crossing moving averages, where you wait for the fast moving average to pass through the slower one, and at the same time the price will be below/above all moving averages at the same time. This improved MA strategy allows you to trade the longest trend situations, just as you can now see in the chart below.

Both of today's strategies perform best in highly trending markets, where their success rates reach more than 70% in some cases. However, the high success rate is only one of their two main strengths, the other being their versatility to be used not only across different markets, but also time frames and even different chart types.


