The Overlapping Fibonacci H1 trading strategy is based on the concept of overlapping Fibonacci levels. Fibonacci levels are widely used in technical analysis and are used in trading practice. One indicator of Fibonacci levels may be important for trading, but two such indicators in combination are a powerful combination.
Most traders come to the concept of overlapping Fibonacci levels on their own, after prolonged use of this tool in their trading.
As a rule, they use Fibonacci retracements or extensions, looking for a match of the Fibonacci level with other signals, such as support and resistance, centers, etc. The idea of overlapping Fibonacci is likely to be an exciting discovery.
Since very often, all you need to trade is when the coincidence of two strong Fibonacci levels with support and resistance zones, for example, is very likely to lead to some applicable reaction. Many traders find the simplicity of such a strategy and do not use anything else in trading.
Fibonacci setup
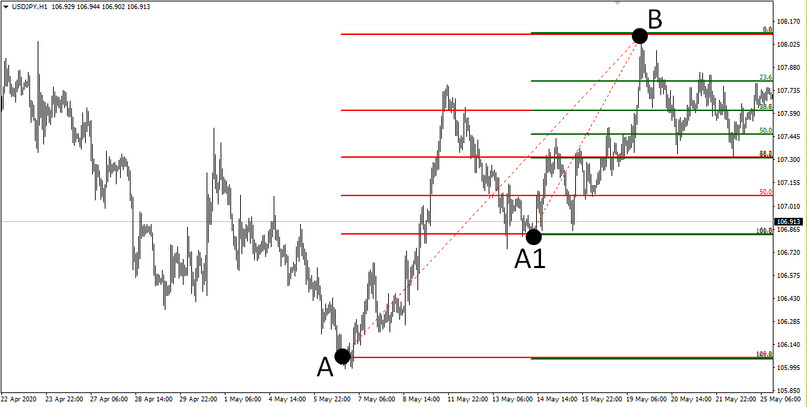
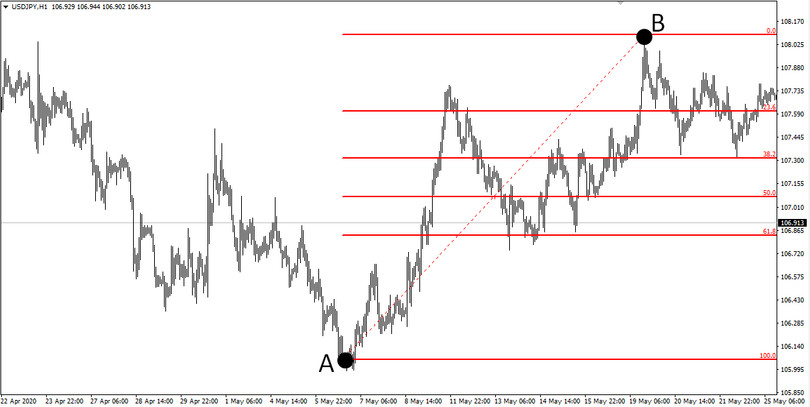
Take any H1 chart with a reasonable price movement up or down, with a few corrections along the way, and set the Fibonacci grid. In the above example, the grid is set to the upward movement of the USDJPY currency pair from point A to point B.
Then from the most significant correction (this is point A1 on the chart), set another Fibonacci grid from point A1 to point B.

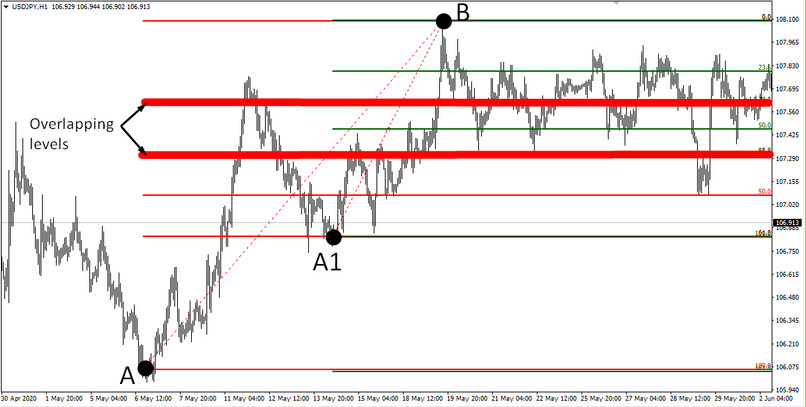
Thus, the graph displays the levels of two Fibonacci grids. The coincidence of the levels of the two grids is the very point at which the price will predictably beat off and return to its original position. In the above example, such resistance was the 38.2% level of the first grid, which coincides with the level of 61.8% of the second grid. Also, coinciding levels were the level of 23.6% of the first grid and the level of 38.2% of the second grid.

Pay attention to the further development of events and how the price behaves near these levels. The first matching levels became a support for the price, and the second matching levels act as the center of the price corridor around which the price revolves.
Thus, the placement of pending orders to buy (in the upward movement) or sell (in the downward) in the places where these levels coincide is likely to indicate the right direction.
Using this strategy in your trading, also focus on nearby levels that can serve as installation sites for stop loss or take profit.
Conclusion
The disadvantages of this trading system include the need for a preliminary analysis. If other computer indicators are enough to just run on the chart, and they are set in automatic mode and begin to search for signals themselves, then the levels are set manually, and the trader himself decides which points to attach to.
Fibonacci levels are a great way to profit in the financial markets for experienced traders. For beginners, it’s not a hindrance to begin to learn the basics of wave theory, as well as master the basic techniques of trading from levels, and only after that start using various strategies using Fibonacci levels.


