With this strategy, you will capitalize on the broad and secular (long-term) trends as confirmed by the signals from the 100-period and 200-period moving averages. To do that, we’ll use a straightforward trading system on lower timeframes that will enable us to time the entries and keep the reward-risk potential high.
Because trades can be held for many weeks and months, this strategy can be effectively used for position trading as well, while some trades will be of shorter duration, such as a few weeks (swing trading).
Timeframes:
● Screening for signals on the daily or weekly charts
● Trade execution one timeframe lower (so 4H or daily);
Currency pairs: any
Indicators used:
· 100-period and 200-period simple moving averages used for the golden and death cross on long-term charts (daily and weekly)
· Stochastic oscillator (standard settings 5,3,3) used to confirm a high-probability entry point based on the golden or death cross
· 8-period and 34-period exponential moving averages (EMAs) for the crossover entry on the lower timeframes (entry charts).
Strategy rules:
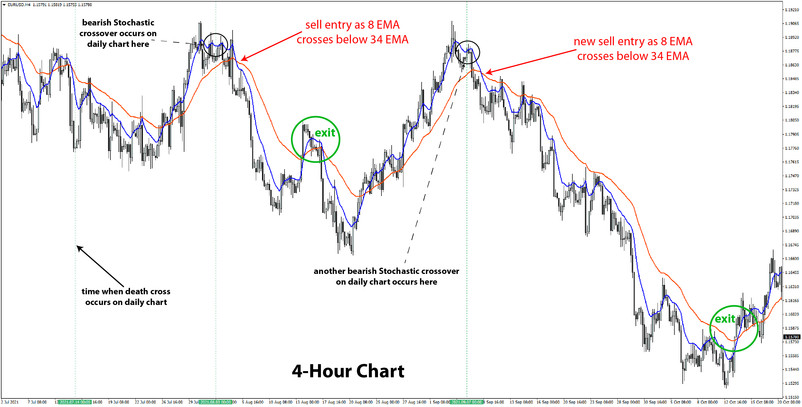
Look for the bullish golden cross or bearish death cross on the long-term timeframes (daily or weekly). Then look for a bullish crossover on the Stochastic from the oversold area for a buy entry. The opposite needs to happen for a short trade – a bearish Stochastic crossover from inside the overbought area.
Then switch to a timeframe one tier lower (i.e., 4-hour or daily), and look for a crossover of the 8 EMA and 34 EMA in the same direction.
Exit when the short-term group of moving averages crosses in the other direction.
Advanced: In some cases, if other quality signals indicate that the trend should continue, it may be appropriate to hold the trade even if the 8 and 34 EMA cross in the other direction.
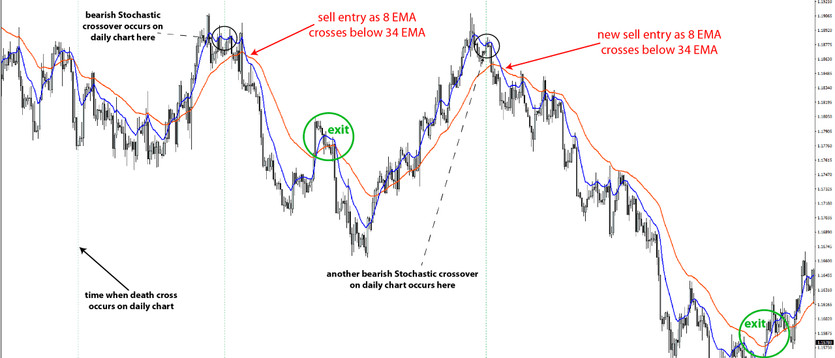
An example of a sell trade with this strategy is shown on the following two charts:

Buy Entries:
- Look for the golden cross (100 MA moves above 200 MA) on the higher timeframe
- The Stochastic oscillator makes a bullish crossover from inside the oversold area (confirms it’s time to start looking for buy signals on lower timeframe)
- Switch to the next lower timeframe and look for a bullish crossover between the 8-period EMA and 34-period EMA
Sell Entries:
- Look for the death cross (100 MA moves above 200 MA) on the higher timeframe
- The Stochastic oscillator makes a bearish crossover from inside the overbought area (confirms it’s time to start looking for sell signals on lower timeframe)
- On the lower timeframe, look for a bearish crossover between the 8-period EMA and 34-period EMA


