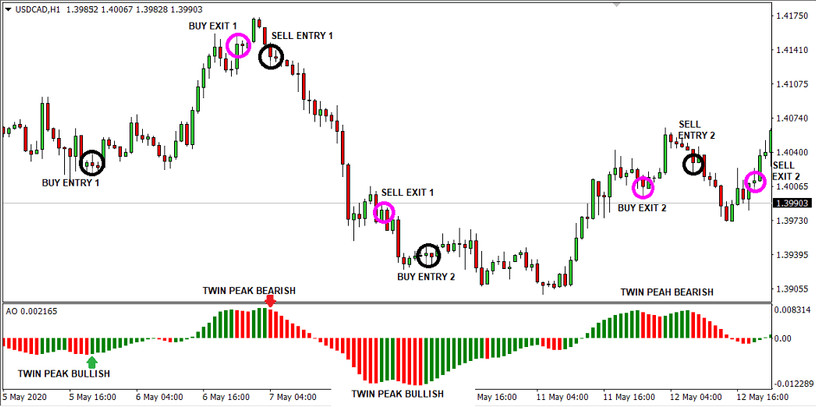
Because of its nature to be an oscillator, the Awesome Oscillator is designed to fluctuate above and below the Zero Line. The generated values are plotted as a histogram of red and green bars. It can help traders to know when is the right time for opening and closing the positions. It has a very nice risk to reward ratio and is seemingly compatible with any timeframe.
Chart Setup
Before we begin, we need to attach the Awesome Oscillator Indicator on our chart. We will trade using this strategy on the H1 timeframe. Please follow the provided guidelines below so that you can get the trading strategy's best trading experience. Below are simple settings we will use for this indicator.
Input for Awesome Oscillator Indicator parameters
- 1st parameter color: Black
- 2nd parameter color: Green
- 3rd parameter color: Red
Buy Trading Strategy
As you can see in the picture above, proceed to buy only when all of the following conditions below occurred:
Entry signal
- When the indicator value is below 0 and has formed the Twin Peak Bullish pattern (two upsides down waves with half bars in red and green), the entry signal is the first green bar of the second wave.
Exit signal
- When the indicator value is above zero, close the trade when the first indicator bar is closed in the red.
- You can use any previous low as your stop loss level, but it is usually better to wait for the exit signal to close your position.
Sell Trading Strategy
As you can see in the picture above, proceed to sell only when all the following conditions below occurred:
Entry signal
- When the indicator value is above 0 and has formed the Twin Peak Bearish (two waves with half bars in red and green), the entry signal is the first red bar of the second mountain.
Exit signal
- When the indicator value is below zero, close the trade when the first bar is closed in green.
- You can use any previous high as your stop loss level, but it is usually better to wait for the exit signal to close your position.


