This is a simple 15 minutes chart scalping strategy. With this strategy, you need a set of two standard indicators. You need the Relative Strength Index (RSI), and the Stochastic.
Settings For The RSI
- Period: 52;
- Price: Close
- Level Overbought =80/70;
- Level Oversold=20/30;
Settings For The Stochastic
- Use the default settings
- Level Overbought =80;
- Level Oversold=20;
Conditions For A Buy Trade
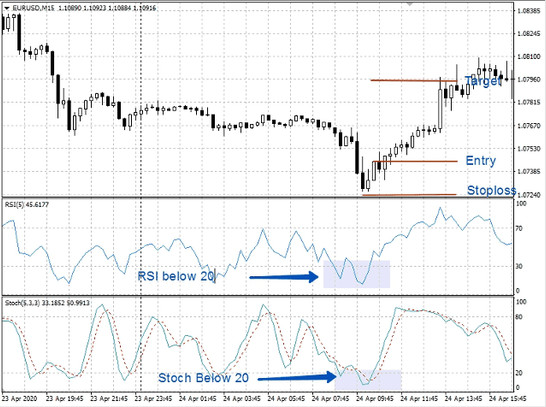
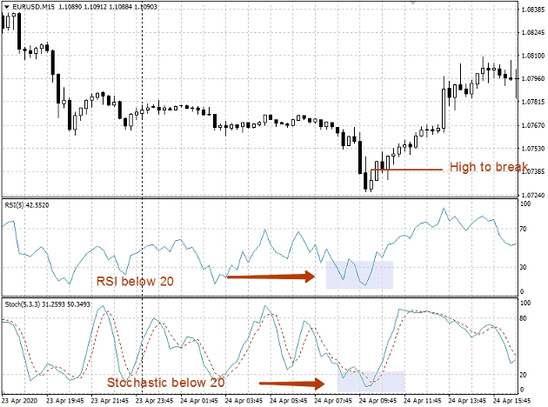
In the case of long positions, four things must happen. The relative strength index must be below the oversold level of 20, at the same time; the stochastic must also be below its oversold level of 20. If the first two conditions are true, wait for the current candle to close above the previous candle’s highest high. Lastly, check and ensure that the candle closing above the previous candle’s high is bigger in size compared to the previous candle, and then pick a low risk buy position.
How To Set Profit Target And Stop Loss Using This Strategy
For Buy positions, your stop loss should be below the recent swing low, and your take profit should be around 10 pips above the entry price (or depending on the current market volatility or the nearest support/resistance price levels).

Conditions For Sell Trades
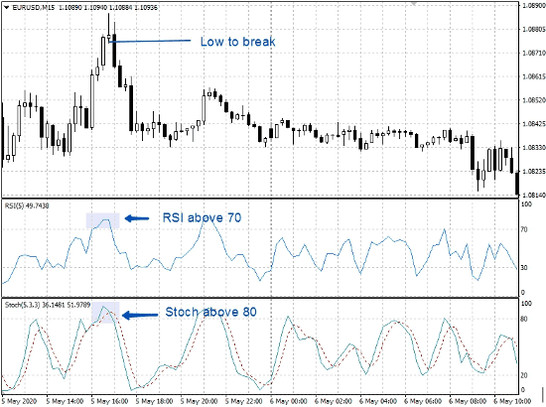
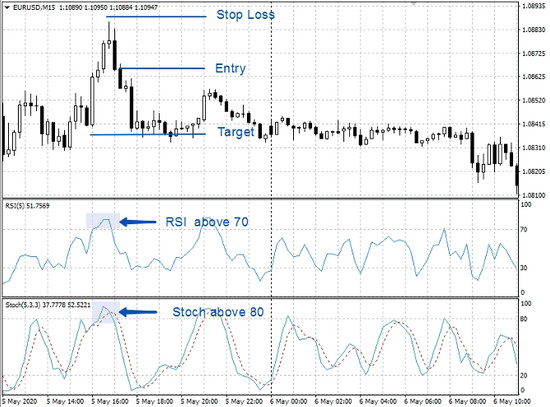
In the case of short positions, four things must happen. The Relative Strength Index (RSI) must be above the overbought level of 80, at the same time, the stochastic must also be above its overbought level of 80. If the first two conditions are true, wait for the current candle to close below the previous candle's lowest low. Lastly, check and ensure that the candle closing below the previous candle's low is bigger compared to the previous candle. In such a situation, pick a low-risk sell position.

How To Set The Profit Target And Stop Loss Using This Strategy
For Sell positions, your stop loss should be above the recent swing high, and your take profit should be around 10 pips below the entry price (or depending on the current market volatility or the nearest support/resistance price levels).

Other Things To Look For
While this strategy looks ideal for the 15 minutes chart, you can apply the same settings on a higher timeframe, and you will still get perfect results.
Also, to further improve the strategy's performance, you can apply filters such as the 52 period moving averages.
Also, if you see candlesticks such as pin bars, engulfing candles, inside bars, and others around the overbought and oversold areas, these are potential signs that potentially profitable trading signals are developing.
This strategy needs a good risk management strategy. Therefore, use a reasonable risk-reward ratio strategy.


