The RSI & ROC Zones Strategy is a trading system that is recommended for use on the H1 timeframe. It is suitable for almost all trading assets, but with the condition that these are volatile assets. The strategy is implemented using two indicators: the Rate of Change (ROC) indicator and the classic RSI. You can download these indicators in the Indicators section of our website.
Indicator Settings
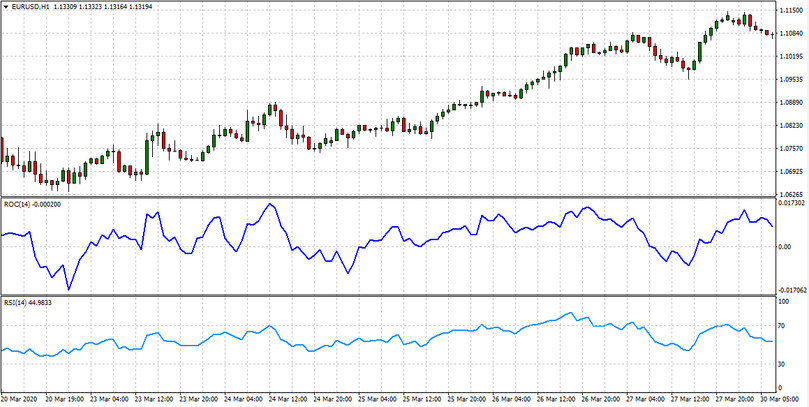
Apply the ROC indicator and RSI indicator to the chart of the trading asset on which you will use this strategy. In the ROC settings, set the RPeriod parameter to 14. For the RSI parameter, the RSI indicator period also set to 14.
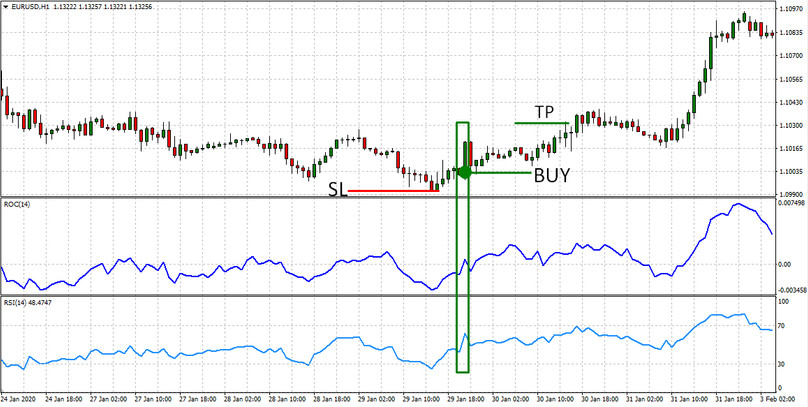
Conditions for opening long positions
A BUY order should be opened subject to two conditions:
1. The ROC line was in the negative zone (below 0), and then sharply turned around and headed up.
2. The RSI indicator behaves similarly. It was located in an area that indicates oversold (below 30). Then the RSI leaves this zone and moves up.
After these conditions are met, you can open a long position.

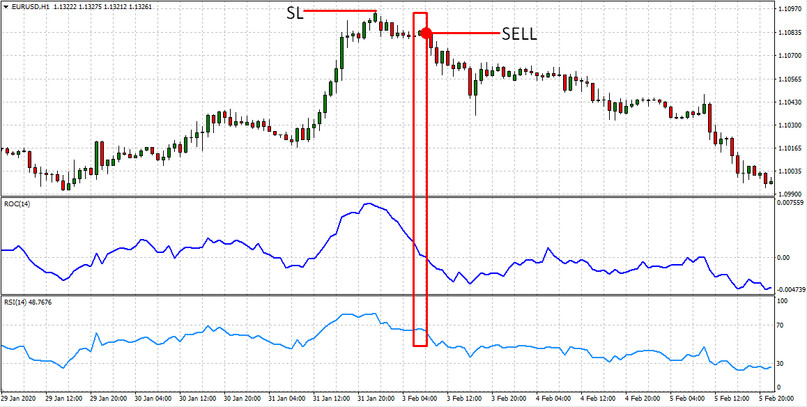
Conditions for opening short positions
To opening a SELL deal, it is necessary that the ROC indicator starts to go out of its positive zone to the negative. And the RSI left the zone, which indicates overbought.

Stoploss and Takeprofit
Set your stop-loss at the lowest extremum from the place of the deal. Take Profit is recommended to set twice as much as the stop loss located at the extremum.
Conclusion
The example demonstrates trades that could be completed on the EURUSD currency pair. Before you start real trading, experiment with this strategy on demo accounts. So you can determine the optimal lot size for the used deposit and the duration of holding deals that will help you choose your trading style.


