Support and resistance are vital concepts as it relates to technical analysis. Here’s how to use support and resistance to build your own profitable trading system.
What Are Support And Resistance?
Support is a price area where the price has a tendency to stop falling. Resistance is a price area where the price has a tendency to stop rising. Support and resistance are generally represented on price charts by lines (or even price zones). Support and resistance lines can be horizontal or they can be diagonal. A diagonal trendline framing the bottom of an uptrend is, in fact, a diagonal support.
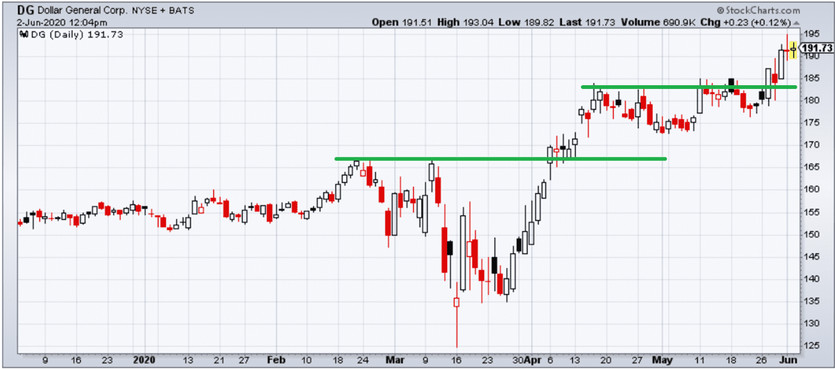
The way we identify support and resistance is by finding areas in price charts where price has a historical tendency to stop. There is a reason why it stops at these points. The psychology of traders gives certain price levels significance. Consider the following price chart of DG (NYSE:DG).
The first horizontal line in the area of $167.25 shows the first resistance level. The first time the price tested that level was on 21 February. The price then retreated below that level and tested it again on 10 March. Once again, the bears stepped in and drove the price back down. Based on these two failed tests of this price level, we can draw a resistance level here.
On 16 April, the area defined by the second horizontal line starts getting tested. This candle is an example of a falling hammer pattern, with the price opening near the bottom of the candle, extending upward only to close much closer to the open.
This candle with its long upper tail and short body is a bearish candle that suggests an end to the trend. This end of the trend is confirmed by the next few days, as a sideways range develops.
Finally, the area tested on 16 April is tested again on 11 May, only to be rejected again. Looking at the price action around that line after 11 May, you can see that the price level is tested, but it never closes above it.
It did open above it, as indicated by the black candle, perhaps due to strong buying after-hours trading. But the price ended up closing below the potential resistance level. We have seen enough to draw another resistance level here. There is a pattern here in both of these resistance levels and the pattern is that price moves beyond them are getting rejected.
How To Trade Support And Resistance
In the case of the first resistance level, you can see that the price eventually breaks through. This is also the case with the second resistance level. A nice feature of support and resistance is that failed support levels become resistance levels and failed resistance levels become support levels.
So, once the resistance levels were broken, we can consider them support levels. That makes them excellent places to enter a trade.
If we had bought on the 6 April candle that closed above the first resistance level and set our stop loss beyond the minimum of the candle, it would have been a good trade. We could have sold on the bearish candle that formed on 16 April and pocketed about $10 a share.
For the second resistance level, we could use the same strategy to enter on the candle that closed above the resistance level on 27 May and our trade would still be going.


