Trading indicators are among the most popular tools that traders use primarily as indicators of trading signals for their future entries.
MACD and Stochastic are among the indicators that are not only tested by many years of tests, but also have been, are and still will be tested by millions and millions of users. Who even though these indicators are already well above the average professional indicators, can certainly still improve them to "perfection".
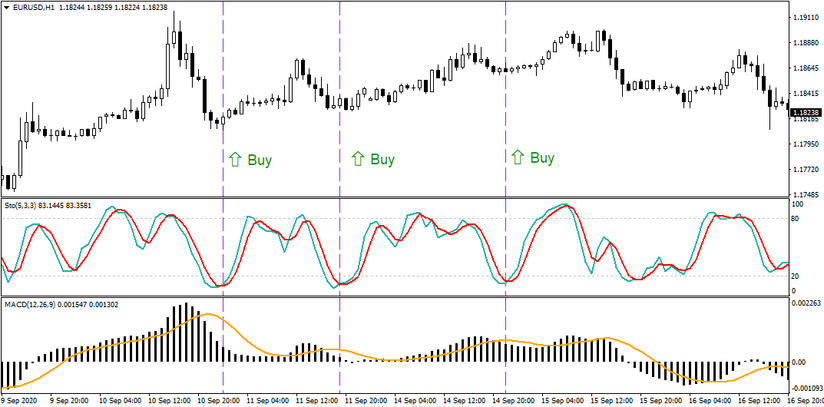
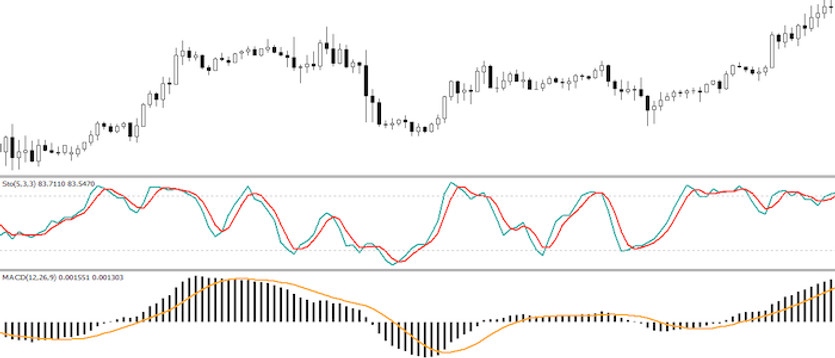
Today's strategy uses a combination of just these two powerful indicators, MACD and Stochastic, which together determine whether or not it is a good time to enter a trading position. The whole strategy works very simply, the MACD in this case determines the current trend situation, if the MACD level (in the chart below - the black shading) is below the zero line then the market is considered to be currently trending downwards, if it is above then it is trending upwards. The Stochastic here has the function of an indicator of local highs/lows, therefore, when the MACD indicates a rise, then entries (long entries) are only made when the Stochastic crosses below the 20 level, conversely, if the MACD indicates a fall, then entries (short positions) are made when the Stochastic crosses above the 80 level.
In the charts above and below it is possible to practically see under what conditions long and short trading positions are entered, and from the charts it is also possible to see how the combination of both indicators can make their signals very precise.

With the combination of the MACD indicator and Stochastic, it is realistically possible to increase the success rate of trades by up to an incredible 30%, thanks to which the overall success rate of today's strategy may eventually exceed 80%, which are very impressive results in terms of today's trading.


