The Symphonie/Cobra Hybrid System trend trading strategy uses signals based on the price chart, rather than indicators, mostly lagging. In particular, moving averages are used only to identify the trend, but not to open a position during their crossing.
The Symphonie/Cobra Hybrid System strategy is of great interest since it uses a non-standard approach to the formation of trading signals and a whole system of their filtering. At the same time, the rules of the strategy will not cause difficulties even for novice traders. It is recommended to use this trading technique on the H1 timeframe. The strategy is suitable for any currency pair.
Strategy settings
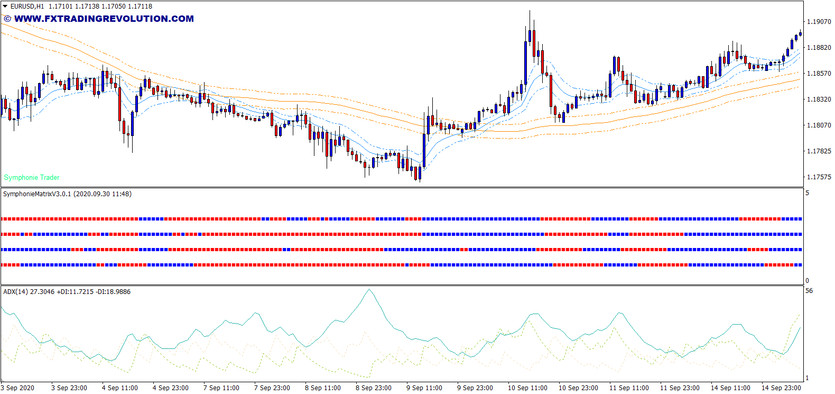
The strategy uses three indicators: Symphonie Matrix, ADX, and Wave. You can download them on our website and configure each indicator manually, or use a ready-made template from the link below.
Symphonie Matrix Indicator and ADX indicators are applied with default settings.
In this strategy, the Wave indicator is used twice. For the first, set WavePreiod 72 WaveMode to 0, and for the second WavePeriod to 12, WaveMode to 1.
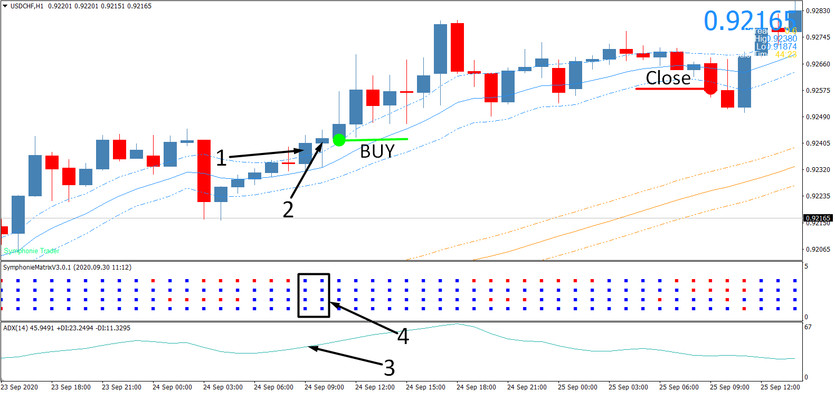
Conditions for opening long positions
1. The bullish candlestick closed above both zones of the Wave indicator.
2. The next candlestick after it is also bullish, opened, and closed above both zones. If the next candlestick is bearish, wait until a bullish candle is formed with the opening and closing prices above both zones. At the same time, this bullish candlestick is not a reversal pattern (star, hammer, inverted hammer, etc.).
3. The ADX indicator is above level 22 and is directed upwards.
4. On the Symphonie Matrix indicator, all squares are blue.
If these conditions are met, a long position is opened.

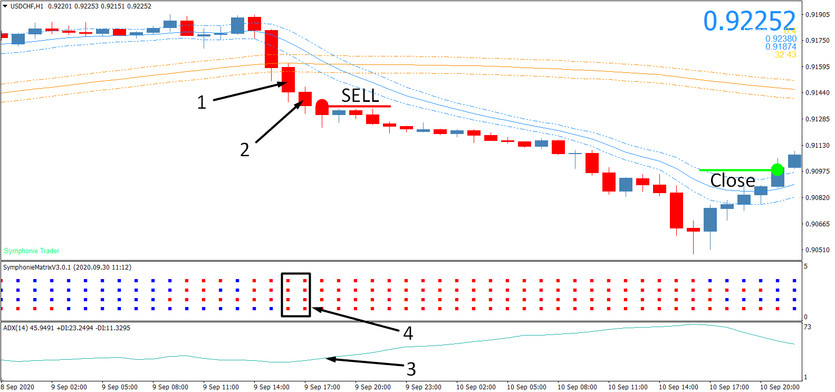
Conditions for opening short positions
1. The bearish candle closed below the lines of both Wave indicators.
2. The next candle is also bearish, opened, and closed below both Wave zones. If the next candle is bullish, wait until a bearish candle is formed with open and close prices below both zones. This candlestick should not be a reversal pattern.
3. The ADX indicator is above level 22 and is directed upwards.
4. On the SymphonieMatrix indicator, all squares are red.

StopLoss and TakeProfit
For buy trades, the stop loss is placed just below the lower border of the blue Wave zone (12), and for sell trades - just above the upper border of the blue Wave zone (12). A predefined take profit is not set; trades are exited after the candle closes above the upper border of the blue Wave zone (12) for sell trades and below the lower border of Wave (12).
Conclusion
As you can see from the description, there are no difficulties and ambiguous signals in this strategy. You can enter and exit the market according to its clear rules. At the same time, as with any other system, do not forget about the rules of money management and risk control.


