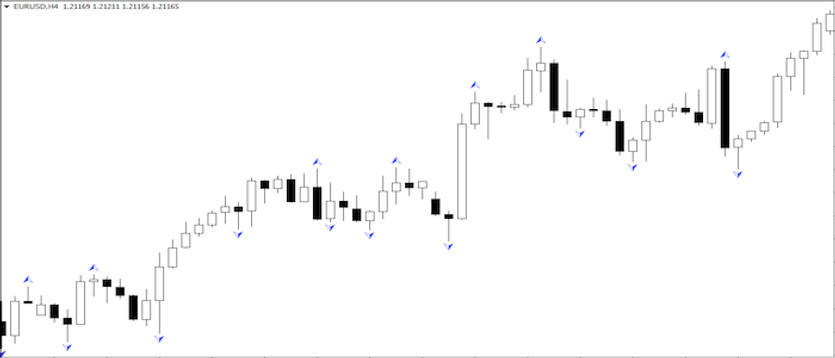
Fractal indicators have been around for many decades and there are therefore countless ways in which they can be traded or used in other ways.
Although at first glance fractals may not seem like an indicator that is particularly exceptional, professionals often see it quite differently. According to them, it is an indicator that clearly indicates the behaviour of the entire market and its values are not distorted in any way by complicated algorithms, which is precisely its great and undeniable advantage.
Strategy input rules (example)
Entering long positions
- H4 time frame
- the change between the bullish and bearish fractal is greater than 600 points
Entry into short positions
- H4 timeframe
- the change between the bullish and bearish fractal is greater than 600 points
How to Trade Fractals
Fractals are among the indicators based on which important S/R levels are indicated. However, fractals alone provide an overabundance of trading signals, so it is not a bad idea to supplement them with something that will reduce this overabundance while leaving only those signals that can be considered strong enough. One such option is to trade only those fractals that arise after the market has created an "above average" (the size is determined by the trader) change between the fractals in a relatively short time (see the chart below - the change between the purple lines and the change between the blue lines). Once this occurs, then as soon as the price reaches the lower or upper line again, trading positions are entered. The Stop-Loss and Take-Profit then depend on the ratio that the trader chooses between the two.
With a strategy based on the Fractal Indicator and price changes, it is possible to achieve a success rate of 40-70%, which, with the right money-management, is fully sufficient for long-term sustainability.


