Inside-bar candlestick patterns show indecision in the market, and a price close beyond either the resistance or the support level may confirm continuation or rejection of a trend. Below is a description of the Inside-bar candlestick pattern.
Description
An Inside-bar candlestick pattern compares two candlesticks that are adjacent to each other.
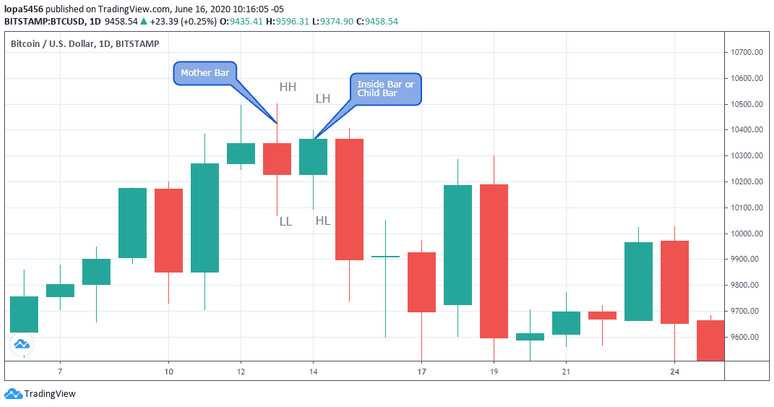
From the image above, it’s is identified by the two candlesticks marked as Mother-bar and inside-bar.
The Inside-bar pattern is a combination of the candlestick on the right with its high and low less than the high and low of the candlestick on the left (Mother-bar).
The smaller candlestick in the inside-bar price formation is sometimes referred to as the child bar or Harami from its Japanese origin.
So how do we trade with the inside bar pattern, you may ask? Enter the breakout or breakdown of inside-bar support or resistance.
Breakdown of Inside-bar Support - Entry and Exit Conditions (Stop Loss, Take Profit)

Entry Level:
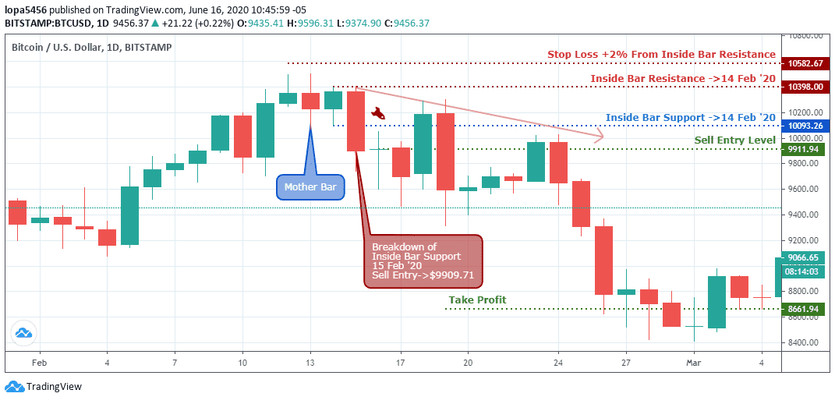
After an Inside-bar candlestick pattern is signaled, an entry to enter a short sell order is flagged if the time frame of the signal closes below the Inside-bar support, as shown in the image illustration of the BTCUSD daily time frame above.
The above image shows the Inside-bar resistance set at $10398.00, and the Inside-bar support set at $10091.26.
A sell order is initialized after the 15 February ’20 price close ($9911.94) below the support level ($10091.26).
Exit in Loss
Taking a loss can be executed in two ways and depends on which one comes first.
The first scenario is by setting a fixed price target known as the Stop Loss level.
The second scenario is via a price close above a significant resistance level.
Let’s take a look at both of them.
Exit by Stop Loss:
For the example chart above, the stop loss level is placed at a safe distance ($10582.67), ranging between 2% to 3.5%.
Exit by Price Close above Significant resistance
The trade can be automatically exited in a loss if the price from the reference time frame close above the Inside-bar resistance ($10398.00) after a sell trade is opened from a breakdown of Inside-bar support ($10093.26).
Exit by Take Profit
When trading the breakdown of inside-bar support, the take profit target can be placed at a risk to reward ratio of 1:1, 1:1.5, or 1:2.0.
The example above has the take profit target set at about 1:2.0 ($8661.94), where the risk is the distance from the entry price to the stop-loss price.
Breakout of Inside-bar Resistance - Entry and Exit Conditions (Stop Loss, Take Profit)

Entry Level:
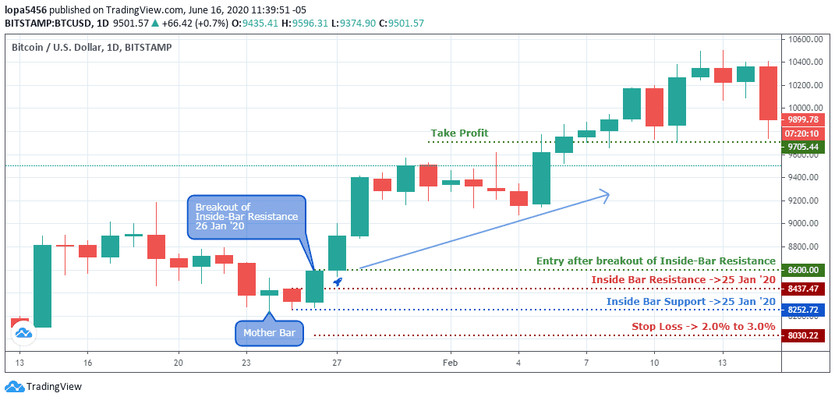
The inside-bar candlestick pattern setup resistance and support levels at $8437.47 and $8252.72, respectively.
A signal to enter a long order is fired after the price close ($8600.00) above the Inside-bar resistance ($8437.47).
Exit in Loss
Similar to the breakdown of Inside-bar support, exits are executed in two different ways, depending on which one comes first.
First is using a fixed Stop Loss target, and the second is a price close below significant support.
Exit by Stop Loss:
Following the breakout of inside-bar resistance, the stop loss level is established at about 2% to 3% price level away from the Mother-bar support.
Exit by Price Close below Significant support
A price close below significant support reduces your risk exposure before the price hits your fixed stop loss level.
From the breakout of Inside-bar resistance shown above, a daily price close below the $8252.72 support shows that the buy trade can be exited if the stop loss level is not yet hit.
Exit by Take Profit
The take profit level for the above buy signal is set at $9705.44, about 1:2 risk to reward ratio of the entry point to the stop loss level, which is ideal for the BTCUSD, considering that it’s high volatility.
However, a risk to reward ratio of 1:1 or 1:1.5 can be deployed for not too volatile asset classes.
Conclusion and Suggestions
To get better results for Breakout or breakdown of Inside-bar support or resistance, traders should consider breakouts or breakdowns in the major trend direction of the analyzed asset class.
The methodology is not best suited for counter-trend strategies, and if you must use it for such, traders can look into a confluence with other chart patterns like divergence.


