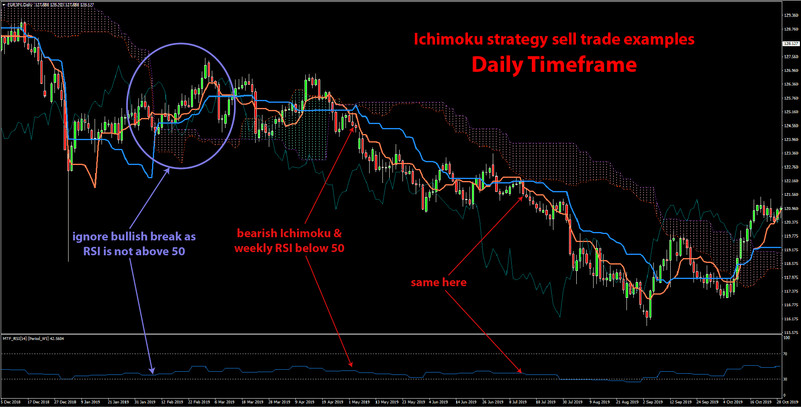
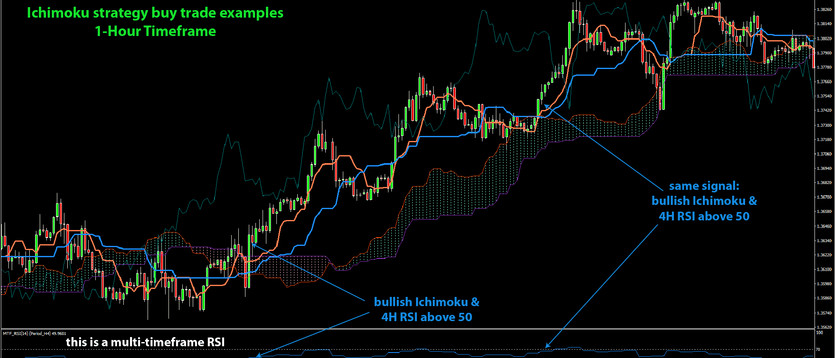
In this edition of our trading strategy series, we introduce another highly-effective strategy with unique advatnages that will help you pick only the high probability trades. It is based on the comprehensive Ichimoku Kinko Hyo indicator for the main trading signal and uses the RSI for confirmation.
This strategy allows for trend trading in different conditions, both reversal and continuation instances. So, you can trade both when the trend changes or to join a trend that is already established.The Ichimoku indicator is a versatile trend trading tool on its own and gives high-quality informaiton and signals about the trend. With this system, combining the MTF RSI indicator, we’ll improve our chances of making a winning trade.
Indicators used:
· Ichimoku Kinko Hyo
· RSI (one timeframe higher) - for this purpose, it’s best to use the multi-timeframe RSI (MTF RSI) – free download here
Strategy rules:
Look for an all round confluence signal from the Ichimoku indicator. That is, for buy trades, the price needs to be above the Cloud, and a bullish crossover should occur on the Kijun Sen and Tenkan Sen lines (the two lines in the middle that look like moving averages).
We then use the RSI indicator to confirm the signal from the Ichimoku and to avoid entering at potential extremes (overbought/oversold levels). To do that, check the RSI on 1 timeframe than the timeframe on which the Ichimoku signal occured.
For example, if there is an Ichimoku buy signal on the daily chart, you should switch to the weekly chart to check the RSI. Here the RSI should be above the 50 level to indicate strong bullish momentum. Moreover, the RSI should also be below 70 as to avoid entering at overstretched (overbought) levels. Remember, the RSI is a momentum indicator, where the 50 level indicates the line in the sand between bullish and bearish momentum. But it can also very successfully be used to trade overbought and oversold levels. In this strategy, we are using both advantages of the RSI indicator.
Hence, we can say that the weekly RSI in the case of buy trades should be between the 50 and 70 levels. In the case of sell trades, the RSI should be between the 30 and 50 values.
A much simpler way to do all this is to use the MTF RSI indicator for MT4. This RSI modification let’s you display the RSI values for a different timeframe than the one you currently have switched on. In this way you can see everything in one chart at a glance without having to swtich higher just to check the RSI. Free download of the MTF RSI for MT4 can be found here.
Here’s a breakdown of the relevant RSI timeframes you need to use for specific Ichimoku timeframes:
· Ichimoku 5-Minute timeframe —> RSI 15-Minute timeframe
· Ichimoku 15-Minute timeframe —> RSI 1-Hour timeframe
· Ichimoku 1-Hour timeframe —> RSI 4-Hour timeframe
· Ichimoku 4-Hour or (6-Hour if you use it) timeframe —> RSI Daily timeframe
· Ichimoku Daily timeframe —> RSI Weekly timeframe
· Ichimoku Weekly timeframe —> RSI Monthly timeframe
Buy Entries:
1. The price is above the Cloud, and a bullish crossover has occurred on the Kijun Sen and Tenkan Sen lines; - most often a situation for entering an already established trend
2. The price breaks the Cloud to the upside and the Kijun Sen and Tenkan Sen lines also confirm the trend is up (they are crossedover bullishly); - most often this situation happens when the trend changes and a new one begins
· In either of the above cases, the RSI should be greater than 50 (momentum is bullish) but not above 70 (which would be overbought)
· Stop above the (Kumo) cloud
· Exit when the Kijun Sen and Tenkan Sen lines cross back in the other direction or if RSI on higher timeframe reaches overbought area (above 70)

Sell Entries:
1. The price is below the Cloud, and a bearish crossover has occurred on the Kijun Sen and Tenkan Sen lines; - most often a situation for entering an already established trend
2. The price breaks the Cloud to the downside and the Kijun Sen and Tenkan Sen lines also confirm the trend is bearish (they are crossedover bearishly); - most often this situation happens when the trend changes and a new one begins
· In either scenario with the Ichimoku indicator, the MTF RSI reading should be below 50 (indicating bearish momentum) but not lower than 30 (not oversold)
· Stop below the (Kumo) cloud
· Exit when the Kijun Sen and Tenkan Sen lines cross back in the other direction or if RSI on higher timeframe reaches oversold area (below 30)


