Characteristics of USDCHF
USDCHF is another major currency pair that is closely tied to risk appetite and risk aversion in the markets. The price behavior is often affected by it and traders who intend to trade the USDCHF pair should keep these risk sentiment related factors in check.
Volatility is normally low on USDCHF compared to other Fx pairs, usually around 50-60 pips, but can rise significantly in times of risk aversion. USDCHF can rise and fall very fast under specific conditions, for example, either risk aversion or risk appetite taking control in the market. Frequently there will be periods of calm low volatility type of price action with sudden increases in this volatility and then a reversal back to low volatility.
Unlike USDJPY, however, USDCHF is not so closely correlated with US or global stock markets. Instead, it tends to be somewhat more reactive to risk-averse instances driven by European woes rather than crises happening elsewhere.
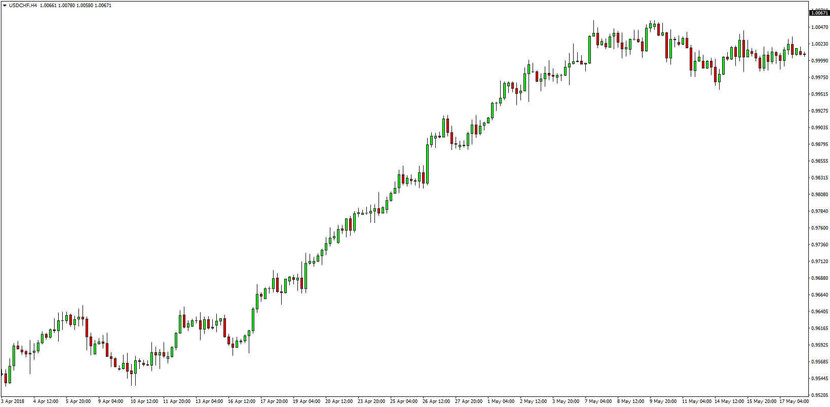
Typical risk-on rallies are also a common occurrence on the USDCHF charts. This type of slow and steady appreciation can rarely be seen on other currency pairs that are not related to risk sentiment. – USDCHF 4-hour chart
It is not typical for USDCHF price action to distinctly respect support and resistance zones, although they can work quite well when regarded as wider zones rather than exact levels. Overshoots of these zones are fairly common which can result in occasional fake breakouts. This can make the pair somewhat difficult for trading, but once one gets used to it and practices trading it for a while it’s fairly easy to get in tune with the usual price behavior even on a pair like USDCHF.
Bullish and bearish patterns or trading signals that were generated on high volatility, particularly on higher timeframes such as the daily or weekly, tend to be more significant and should be taken as more important compared to signals generated on very low volatility. In fact, fake-outs are more likely if a breakout occurs on lower than normal volatility.
Trendlines and channels are not the most reliable tool, and in fact are rarely defined clearly on the USDCHF charts. Similarly to horizontal support and resistance zones, sloping trendlines also tend to work more like wider zones rather than specific levels. For these reasons, trendlines and channels on the USDCHF pair should be traded carefully as their existence is not a guarantee that they will be respected by the price.
Round numbers also have a tendency to be respected often, especially on intraday charts where this is even more evident. Hence, round numbers can be regarded as support and resistance levels that can give us important insights into which technical levels we need to pay attention to.
Finally, trading the CHF, one always has to be aware of the possibility of central bank intervention (SNB intervention). Read more on this in the article on EURCHF here.
Now, let’s get into some common entry patterns or signals that appear on USDCHF.
Trading USDCHF:
Long trade entries: Long trade stop loss: Long trade exits and targets:
- Look to enter on bullish signals at already established support areas or to join bullish trends on increasing bullish momentum. USDCHF can very often start an uptrend at a slower pace and then progressively accelerate higher. Momentum oscillators such as the MACD can help in determining the momentum behind a move.
- Timing the move is also an important aspect here. It happens quite often for the trader to be right about the direction in which the pair will move but if he enters too early or too late then the trade still won’t profitable trade.

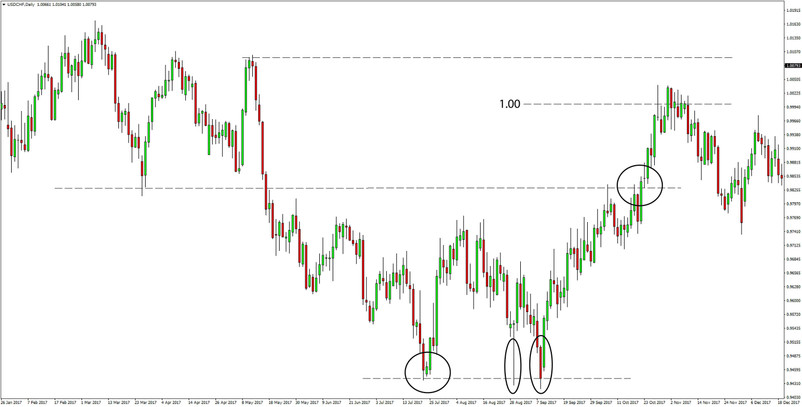
USDCHF Daily chart - The 0.9450 support zone was tested 3 times after which USDCHF started an uptrend. There was solid momentum on the last 2 bearish attempts at this support which provided good opportunities to buy. On the right side, the momentum breakout above the 0.9800 resistance zone (marked with the circled area) indicated that momentum will accelerate and USDCHF indeed reached the 1.00 round number level
Short trade entries: Short trade stop loss: Short trade exits and targets:
- Risk-off driven bearish moves can provide excellent trading opportunities as the momentum can be strong, but also often times, those instances could end up being a trap. Especially, one needs to be careful to not enter momentum short trades too late (aka selling at the bottom). On many occasions, the move will stop just as it looks that all hope for any bounce is lost and then reverse all of the losses.
- Bearish signals that confirm resistance zones are a relatively good bet here also as are decisive breakouts below important support zones.
- But again, it pays to find out what’s causing a sell-off in a risk-sensitive currency pair, since the behavior can differ when it’s being driven by risk aversion compared to other factors.

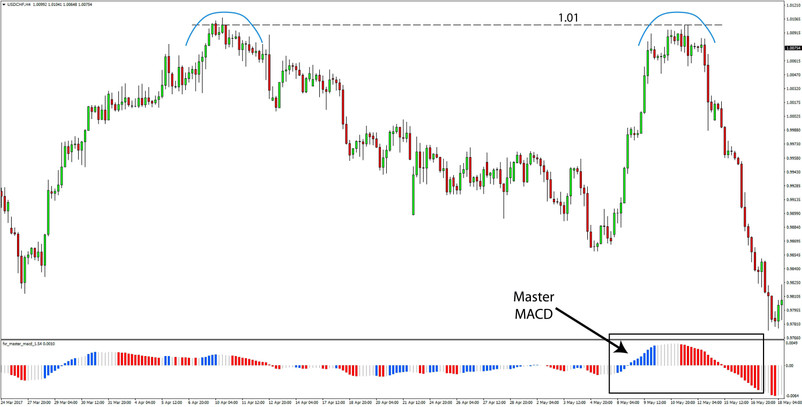
USDCHF makes a U-turn - not an uncommon situation for this pair in both bullish and bearish occasions. The Master MACD indicator picked the reversals accurately - USDCHF - 4-hour chart


